S1CPU usage above 90%
__name__=cpu_usage_idleident=n9e-demo-01busigroup=DevOps
Fired 02:14:07Firing for 14m
Delivered


APACHE-2.0 · SELF-HOSTED · NO VENDOR LOCK-IN
Nightingale (n9e) is an open-source alerting engine. Keep your metrics and logs where they are: write and run alert rules across Prometheus, VictoriaMetrics, Elasticsearch, ClickHouse, and more — from one place — and send alerts to Slack, PagerDuty, or whatever your team already uses.
Run the whole stack locally
git clone https://github.com/ccfos/nightingale.gitcd nightingale/docker/compose-bridgedocker compose up -d
HOW IT WORKS
Nightingale does not take over your storage. It does one layer well. Here is how data moves through it — each stage is a real object in the product.
event — data becomes an alert here
datasource
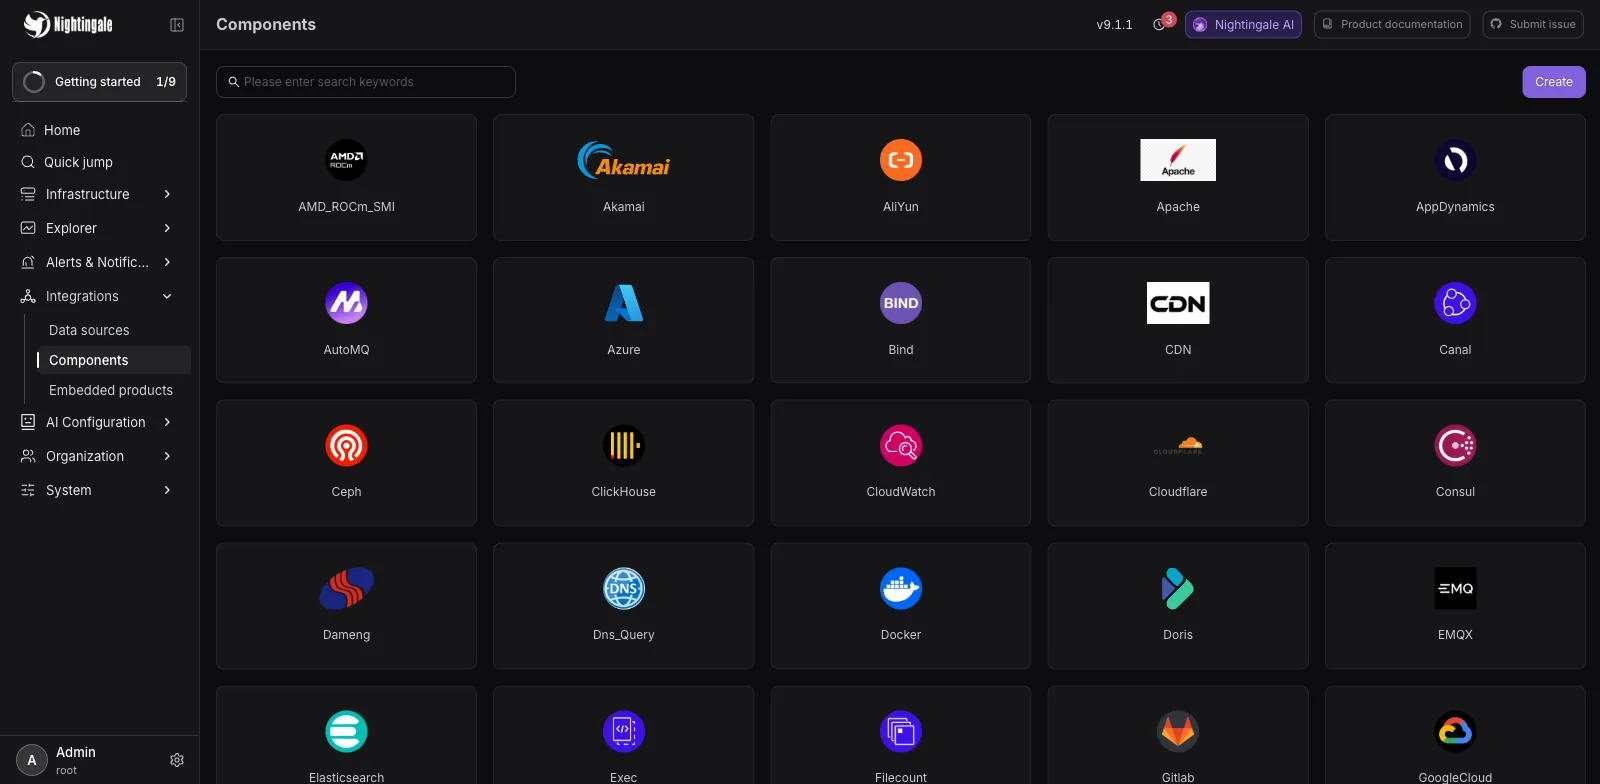
No migration. Register Prometheus, VictoriaMetrics, ElasticSearch, ClickHouse or Loki as a data source and Nightingale evaluates alerts on top of it. Nothing collecting yet? Categraf covers operating systems, middleware and databases in a single agent and writes straight in over Prometheus Remote Write.
rule
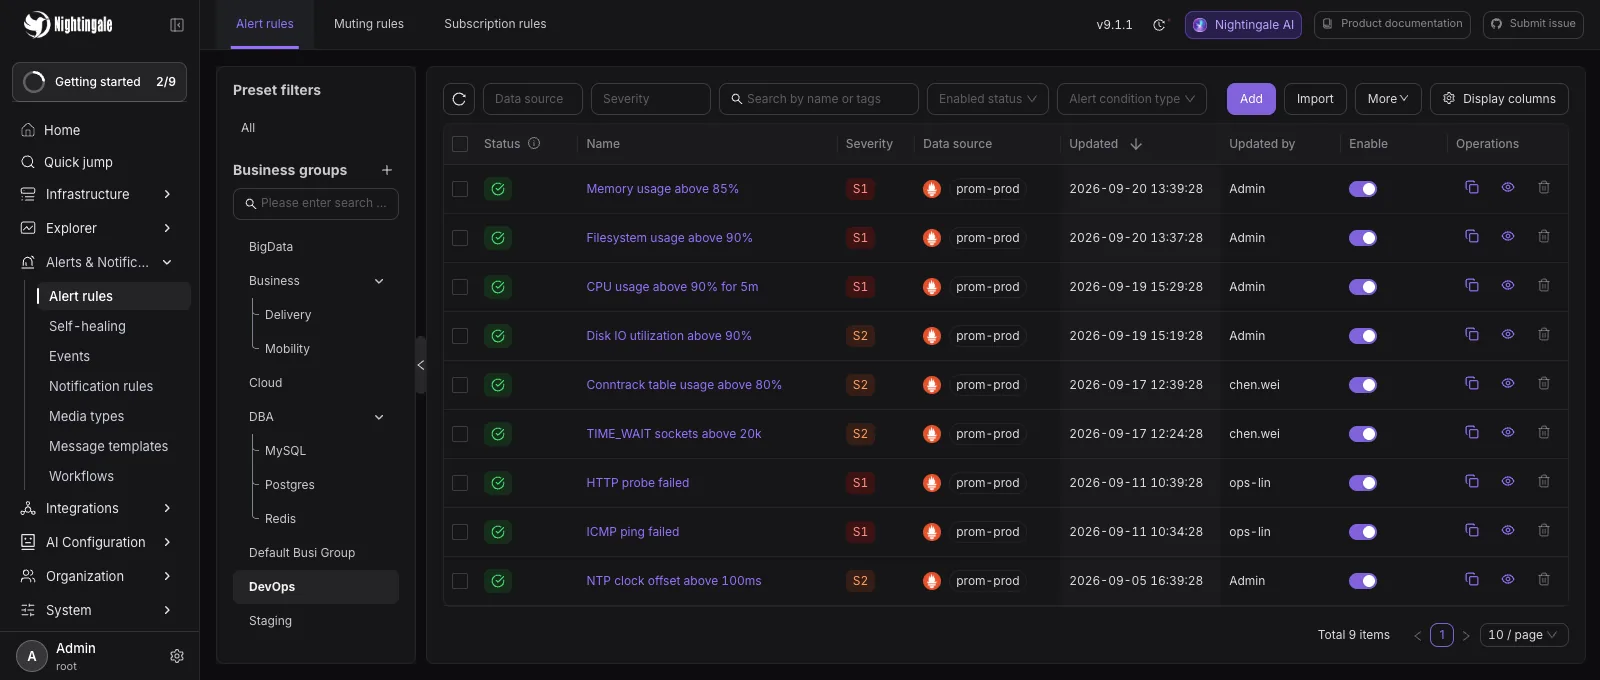
Metrics, logs and SQL-queried stores share one rule model, so there is nothing new to learn per data source. Rules are configured in the UI, scoped by business group, and graded S1 / S2 / S3. A library of common rules ships with the install, so you never start from an empty page.
event
Storms collapse into an aggregated view by business group and severity. Mute rules, subscriptions and event pipelines filter what is left, and the survivors reach people through 20 notification channels. Wire up ibex when an alert should fix itself.
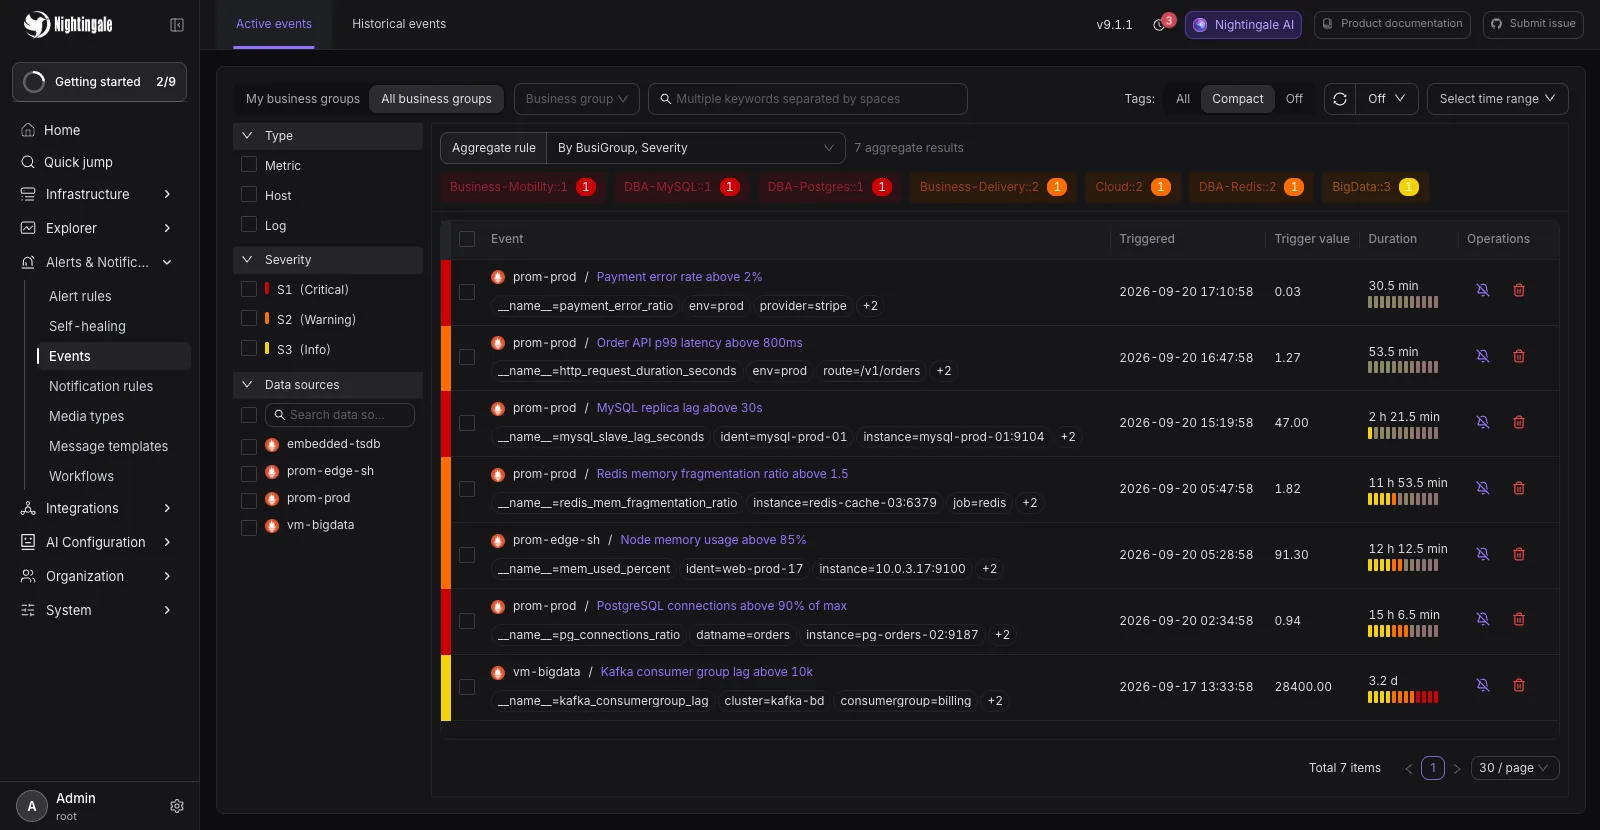
agent
Since v9 the n9e process is itself an MCP server. Claude Code, Cursor and anything else that speaks MCP connect to /mcp and manage alerting in plain language. There is no extra process to deploy.
{
  "mcpServers": {
    "nightingale": {
      "type": "http",
      "url": "http://127.0.0.1:17000/mcp",
      "headers": { "X-User-Token": "<your-token>" }
    }
  }
}
BUILT-IN MCP SERVER
The MCP endpoint lives inside the n9e process, so it is not one more component to operate. Every tool call is dispatched onto Nightingale’s own HTTP API carrying your token — a client can never reach anything its token’s owner cannot.
Toolsets
The write tools are not registered until you turn them on in config. Authenticate with a personal token or OAuth 2.1: Nightingale can act as the authorization server itself, so hosted clients like Claude and ChatGPT connect with zero pre-registration, or as a resource server in front of your existing Keycloak, Entra ID or Okta.
which S1 alerts from last night are still firing?
nightingale · get_alert_events severity=1 status=firing
3 still firing. Longest: mysql-prod replica lag > 30s, 2h14m
what did memory on mysql-prod look like this past hour?
nightingale · query_metrics ident=mysql-prod range=1h
Peak 87.4%, now 62.1%. No memory rule fired.
mute the replica lag alert until 9am, reason "change window"
nightingale · create_mute_rule scope=mysql-prod until=09:00
✓ Mute rule #1024 created, expires tomorrow 09:00
INTEGRATIONS
Nightingale never asks you to replace what works. Data sources, collectors and notification channels all plug into what is already running.
DATA SOURCES · Data sources
 Prometheus
 VictoriaMetrics
 ElasticSearch
 ClickHouse
 Loki
Loki VictoriaLogs
 MySQL
MySQL PostgreSQL
 TDengine
 OpenSearch
 Doris
Doris IoTDB
IoTDBNOTIFICATIONS · Notification channels
SlackPagerDutyTelegram Discord
 Jira
Jira Mattermost
 FlashDuty
 DingTalk
 Feishu
 WeCom
WeComDEPLOY
Apache-2.0, fully featured. One compose command brings it up; binaries and Helm are there too.
docker compose up -dDownload and install →Deploy n9e-edge as a local alerting engine where the link to the center is unreliable. Alerts keep firing and keep being delivered through a network partition.
n9e-edge --configs etc/edgeAbout the edge architecture →COMPARISONS
Each tool has its ground. Keep Prometheus or VictoriaMetrics for storage — Nightingale argues only for owning the alerting layer.
Same data, but rules get a UI, permissions get a model, and channels come built in.
No second collection stack. It reads the time-series and log stores you already fill.
Grafana is the visualization standard. Nightingale spends everything on the alerting engine.
WHO USES NIGHTINGALE
Automotive, electronics, gaming, cloud, logistics, retail.































Bring up Nightingale in five minutes, point it at your data, and watch the first alert land.
Community·Slack #n9e·GitHub Issues