Linux OS
For monitoring systems, the strength of basic functions is indeed crucial, but how to implement them in different scenarios is even more critical. In the “Monitoring Practice” chapter, we collect various monitoring practice experiences, which will be categorized by different components. If you have good practice experiences with a certain component, you are welcome to submit a PR and attach your article link to the corresponding component directory.
- Best Practices for Linux Host Monitoring
- Thoroughly Understand Machine Monitoring Through Node-Exporter
FAQ
1. I can see the machines in my machine list and also see information like CPU and memory of the machines, but no data can be found in the dashboard
💡 Note: The CPU, memory and other information in the machine list are not stored in the time-series database, but in Redis. They are reported when Categraf calls Nightingale’s heartbeat interface, which is a different path from Remote write.
Troubleshoot this issue from the following aspects:
- Check Categraf’s logs
As IT practitioners, the first reaction should be to check the logs of related components. Categraf’s logs are output to stdout by default. If Categraf is managed by systemd, use journalctl to view them, such as journalctl -u categraf.service. If you are not very familiar with Linux, you can directly start Categraf in the foreground on the command line to view the logs more conveniently:
./categraf
Starting the Categraf process in the foreground as above will output the logs directly to the terminal for easy viewing.
- Confirm Categraf’s configuration
The fact that you can normally see content in the machine list indicates that the heartbeat configuration in Categraf’s configuration is normal. If no monitoring data is visible in the dashboard, there may be a problem with the writer configuration. The url in the writer part should be configured as the address of Nightingale, and the urlpath is /prometheus/v1/write.
- Confirm Nightingale’s configuration
Categraf pushes data to Nightingale, and Nightingale does not store data directly but forwards it to TSDB, which can be Prometheus or VictoriaMetrics, etc. Which TSDBs does Nightingale send data to? It is determined by Pushgw.Writers in Nightingale’s configuration file config.toml.
It is necessary to ensure that the configuration in Pushgw.Writers is correct and that Nightingale’s n9e process can normally access these TSDBs.
- Check Nightingale’s logs
If data forwarding to the time-series database fails, Nightingale’s logs will have relevant prompts. Checking Nightingale’s logs can help locate the problem. A common mistake among new users in the community is that Nightingale writes data to Prometheus, but Prometheus has incorrect startup parameters and does not enable the remote write interface, resulting in Nightingale’s failure to write data. Such errors are usually prompted in Nightingale’s logs, and you can directly see what parameters should be added to Prometheus, just modify them accordingly.
- Time synchronization
For example, check whether the time of the local laptop is consistent with that of the server. Monitoring systems are very sensitive to time. If the time is not synchronized, it may cause data to not be displayed normally.
- Check the dashboard configuration
Some dashboards view all data in the time-series database, while others can only view monitoring data of machines under the business group (controlled by dashboard variables). For the latter type of dashboard, it is necessary to ensure that there are machines under the business group.
2. Can I write monitoring data to other time-series databases such as TDEngine?
First, you need to understand the Prometheus remote write protocol (you can ask Google or GPT). The data collected by Categraf is pushed to Nightingale through the Prometheus remote write protocol, and Nightingale also forwards data to the time-series database through the Prometheus remote write protocol.
Therefore, if a time-series database supports receiving data via the Prometheus remote write protocol, it can be connected to Categraf or Nightingale. Where to get this information? Check (or search) the time-series database’s documentation. If it supports receiving data via the Prometheus remote write protocol, it will most likely be mentioned in the documentation. If it is not written in its documentation, it is probably not supported or not well-supported and not recommended.
3. How to monitor machine disconnection?
In Prometheus, each machine deploys Node-Exporter, and Prometheus actively fetches data from Node-Exporter. This method is called PULL. The advantage of this method is that Prometheus can know whether the machine is disconnected, because if the machine is disconnected, Prometheus cannot fetch data. If the fetch is successful, there will be an up indicator with a value of 1; if the fetch fails, the value of the up indicator is 0.
Therefore, in Prometheus PULL mode, the up indicator can be used to monitor whether the machine is disconnected.
Nightingale uses Categraf to collect machine monitoring data by default. Categraf does not expose the /metrics interface, but pushes data to Nightingale through the remote write protocol, which is called PUSH mode. In this mode, there will be no up indicator, so how to monitor machine disconnection?
Nightingale’s alert rules provide a Host type alert rule, which can be configured for disconnection alerts:
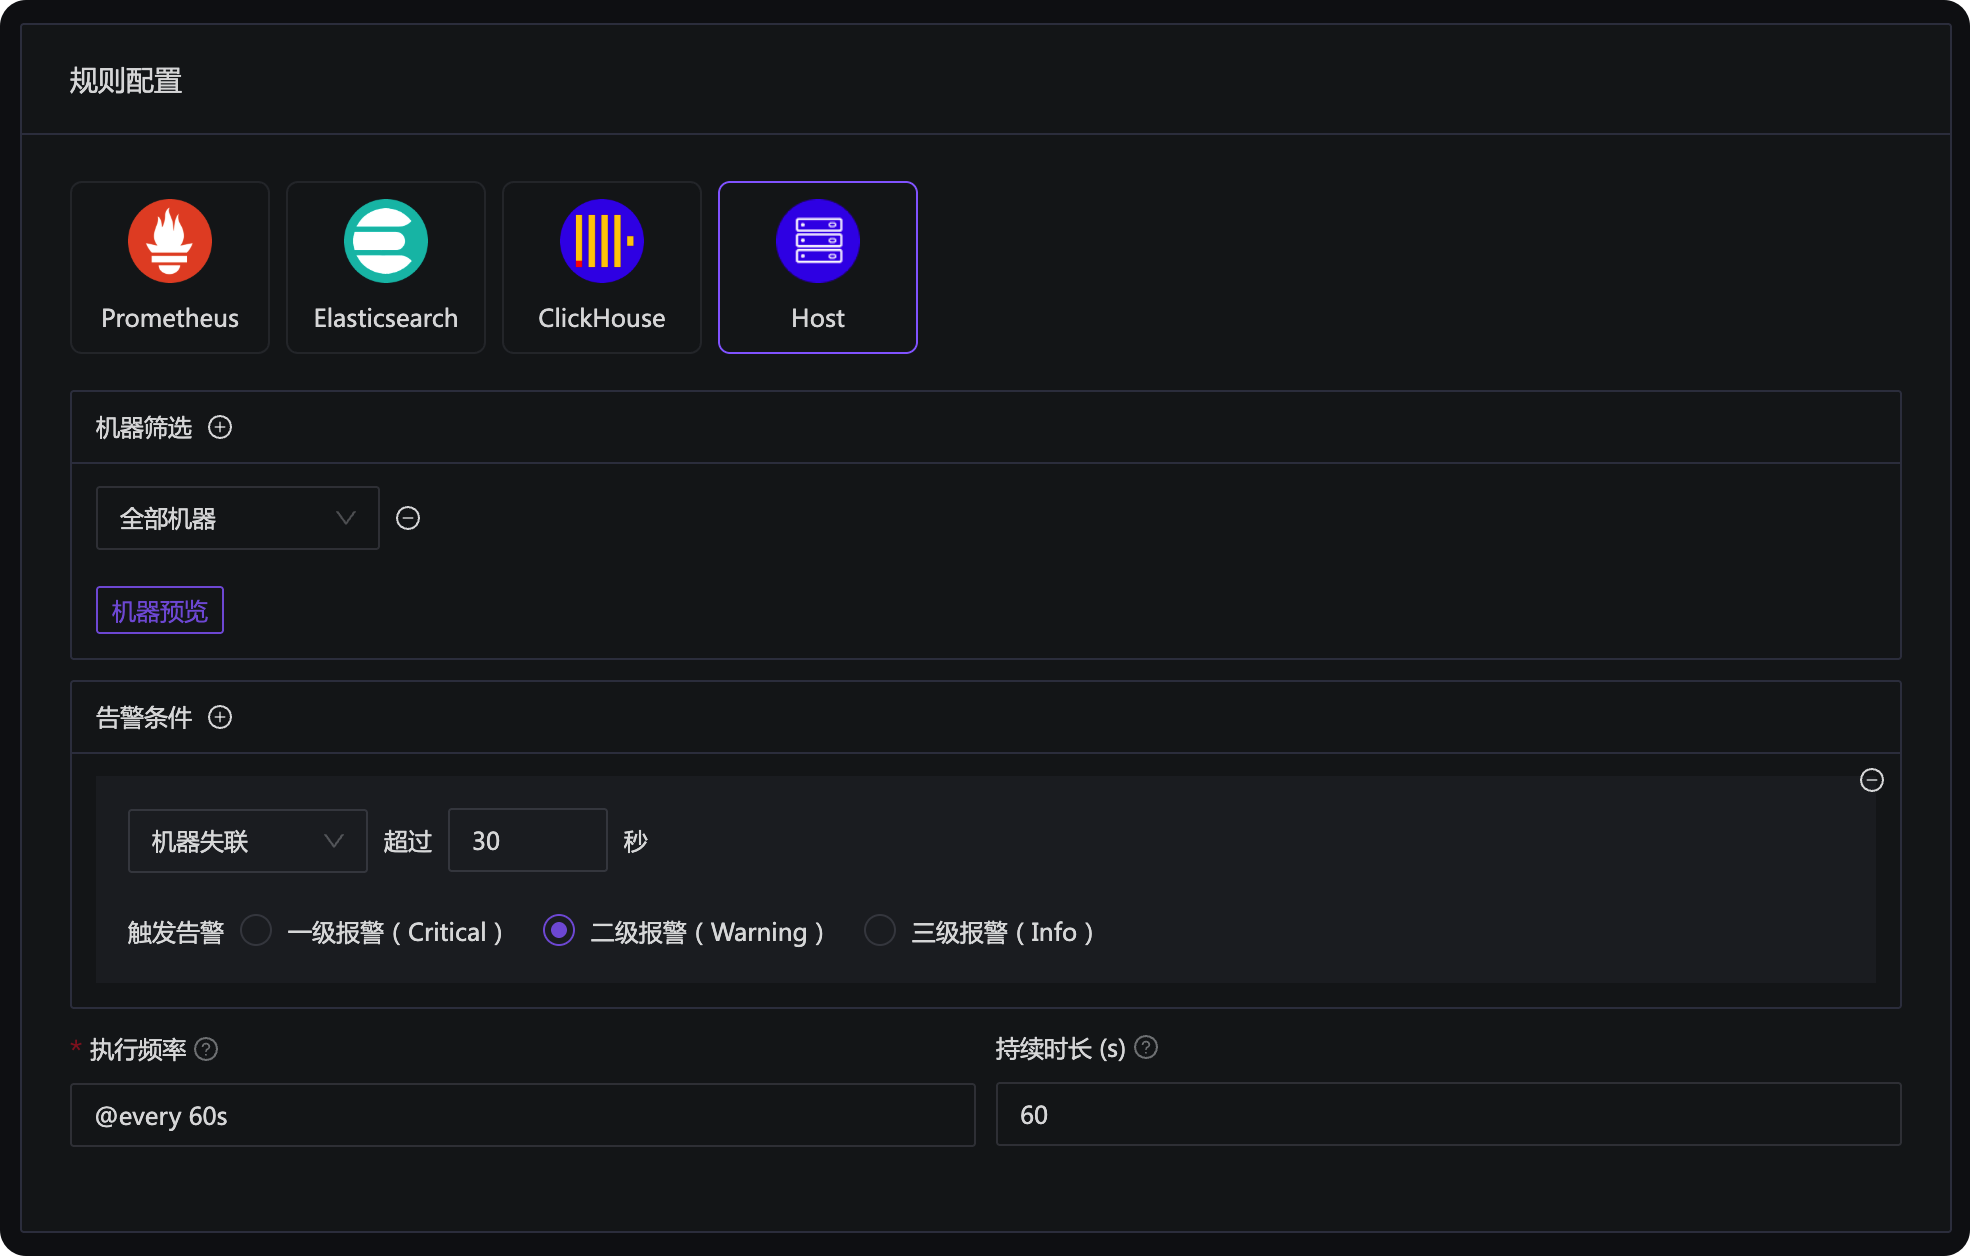
It is usually configured to take effect for all machines. If you have some special machines for which you do not want to set disconnection alerts, you can put these machines into a special business group or mark them with special tags, and then filter them out in the machine selection here.
Alternatively, use PING monitoring to initiate PING detection on the machine and configure alert rules for the PING detection results. Many monitoring tools support PING detection, such as Telegraf, Categraf, Blackbox Exporter, etc.