Architecture
Nightingale’s architecture is relatively simple. For testing purposes, a single binary can be used to start it. However, for production environments, it relies on MySQL and Redis. Some companies have multiple data centers, and some edge data centers have poor network quality; Nightingale has been specifically designed to address such scenarios.
Architecture Diagram
If we do not consider the edge mode, Nightingale has only one main process, the n9e process, which relies on MySQL and Redis to store some management data. It can connect to various data sources, and the technical architecture diagram is as follows:
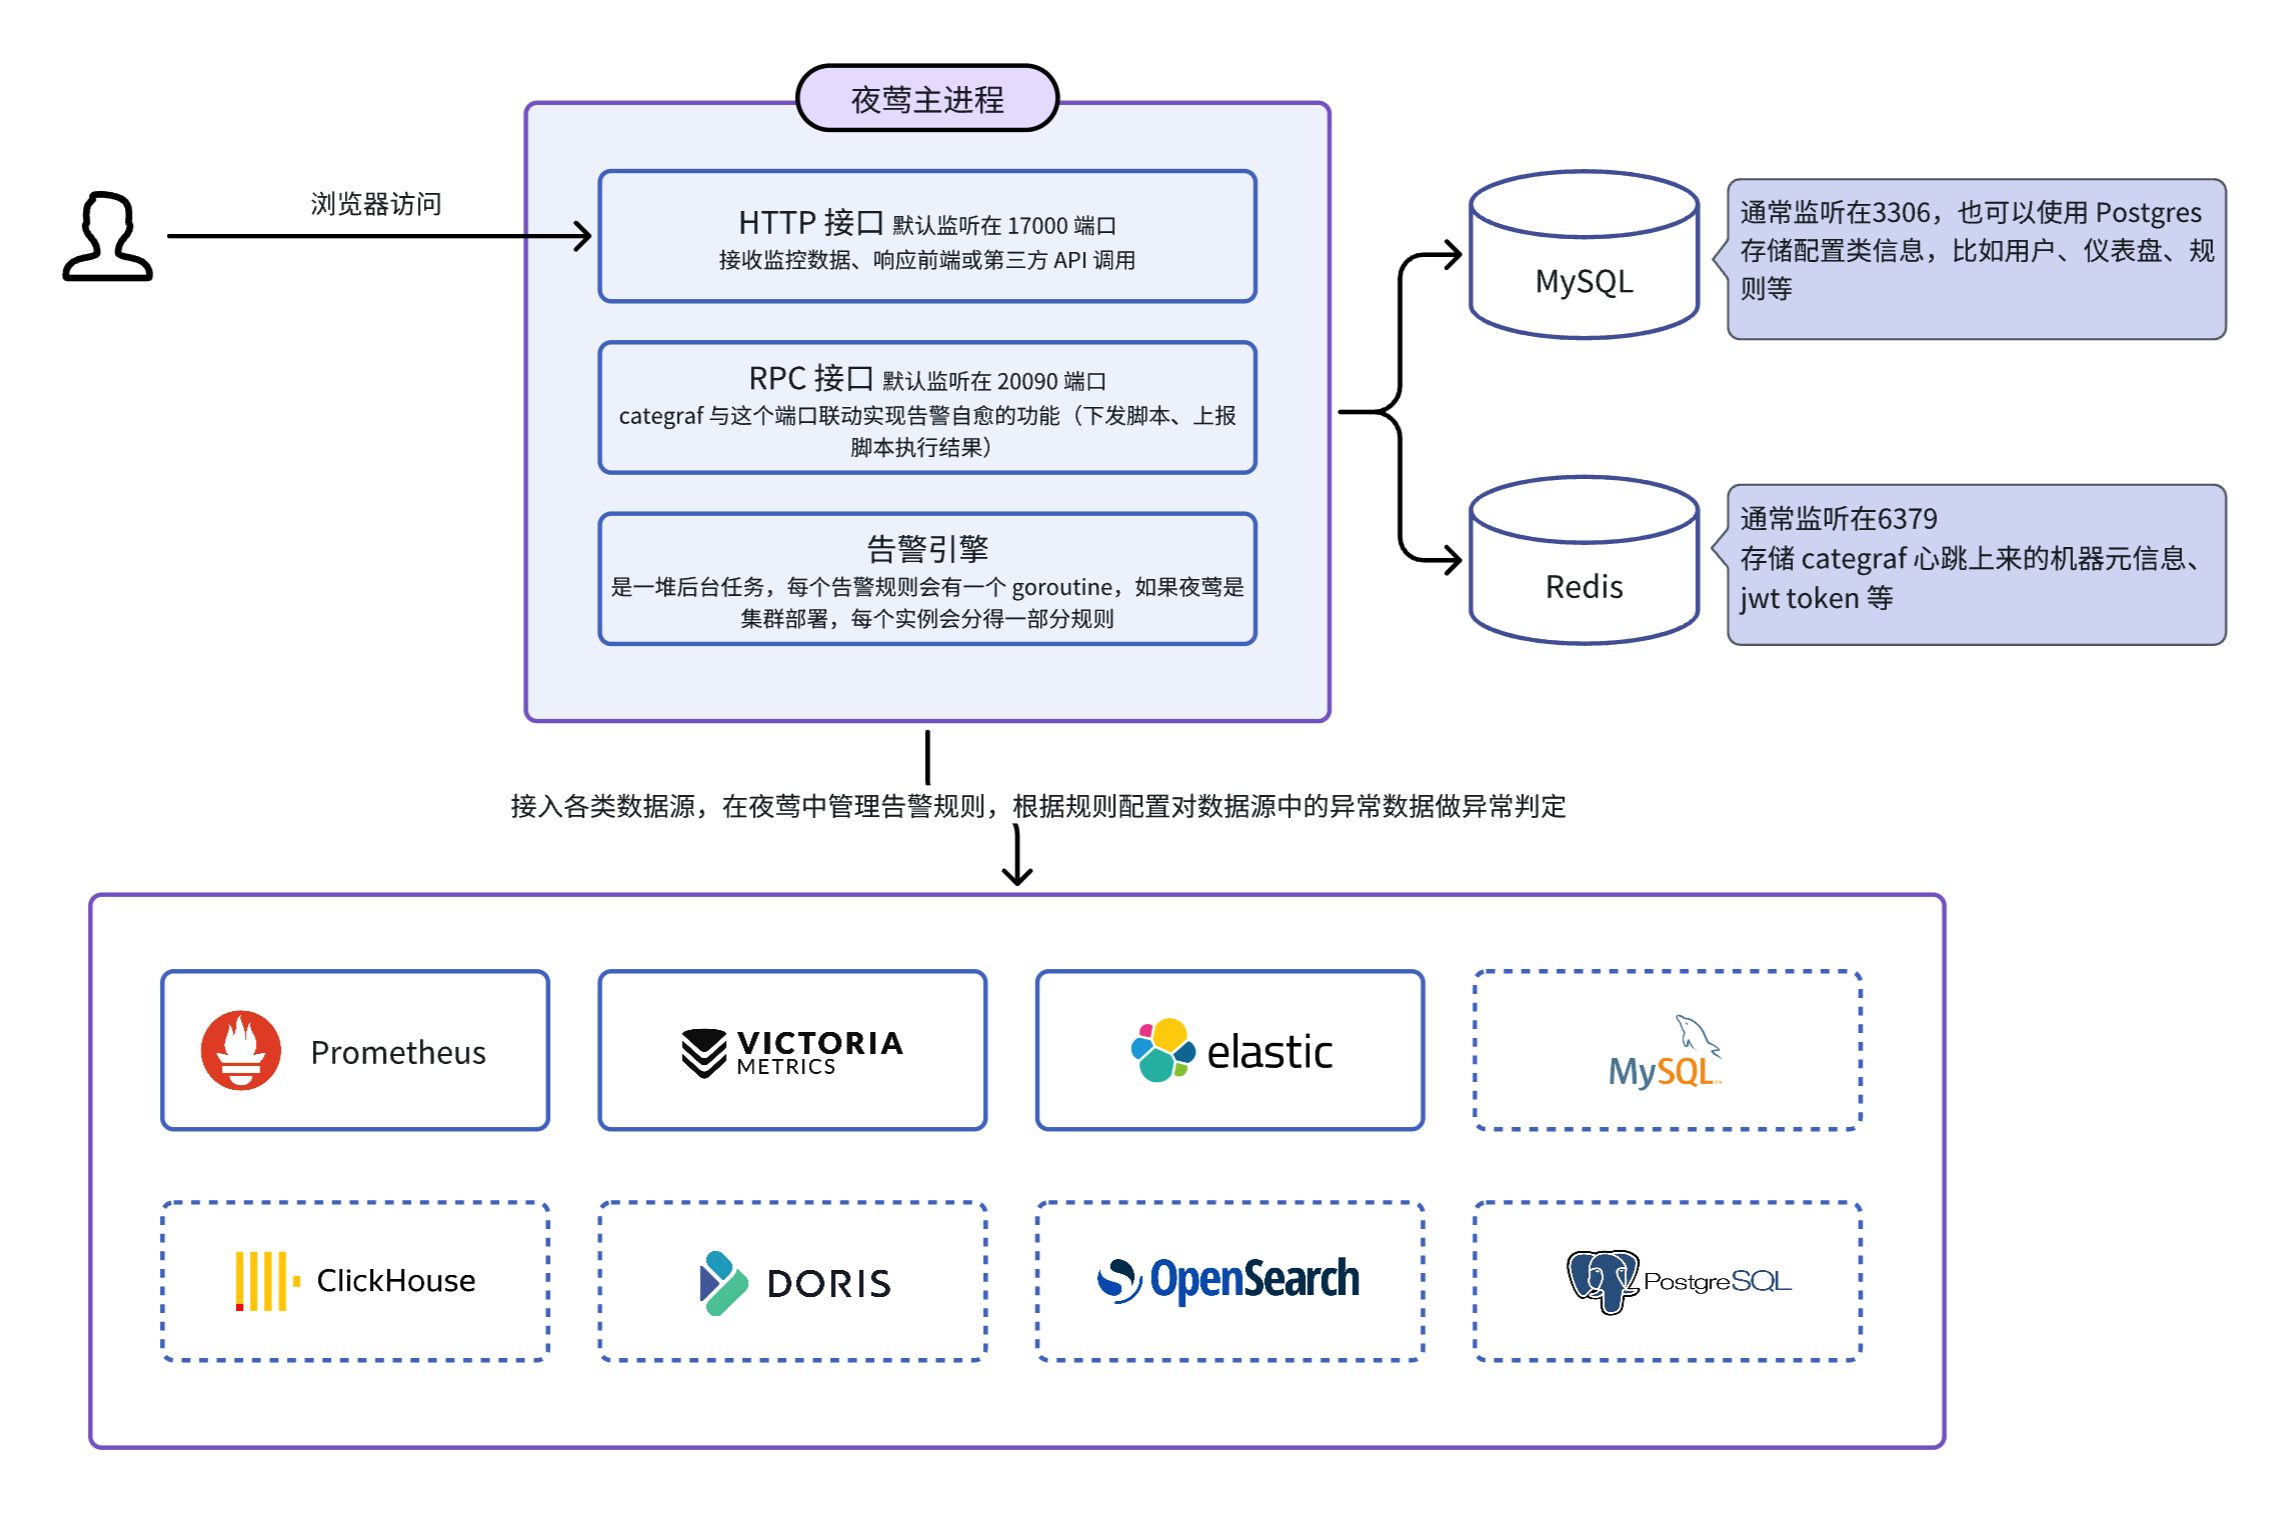
Initially supported data sources include Prometheus, VictoriaMetrics, and ElasticSearch, which support both visualization and alerting. However, Nightingale is focusing more on the alerting engine, so new data sources will only support alerting.
Based on whether the monitoring data flows through Nightingale, we can distinguish two modes:
- Mode 1: Monitoring data does not flow through Nightingale. Users handle data collection themselves and only configure the time-series databases in Nightingale for visualization and alerting. The architecture diagram above is a typical example of this mode.
- Mode 2: Data flows through Nightingale. Categraf pushes data to Nightingale via the remote write protocol. Nightingale does not store data directly but forwards it to time-series databases, which are determined by the
Pushgw.Writersconfiguration in theconfig.tomlfile. The architecture diagram for Mode 2 is as follows:
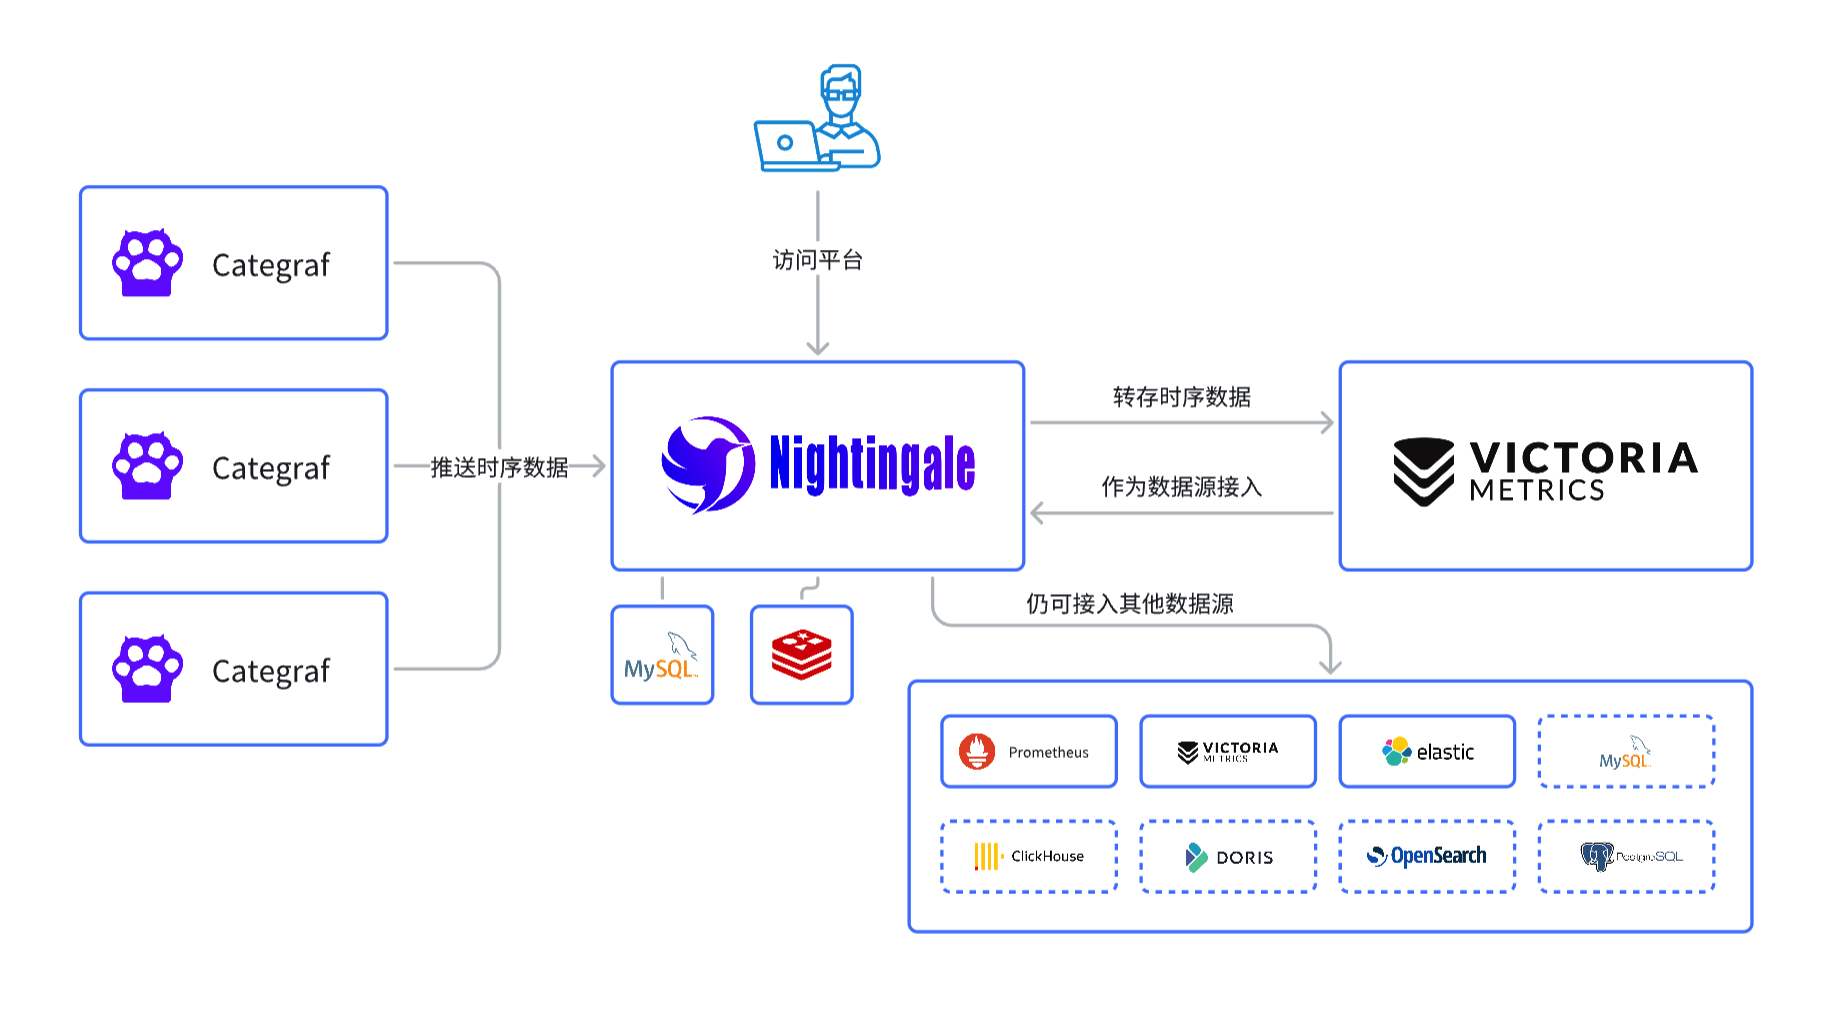
In the diagram above, Nightingale receives monitoring data and forwards it to VictoriaMetrics. It can also forward data to Prometheus; if you want to forward to Prometheus, remember to enable the remote receiver feature when starting Prometheus (you can check which control parameter to use with ./prometheus --help | grep receiver), which enables the /api/v1/write interface in Prometheus.
🟢 If you are a new user, it is recommended to use VictoriaMetrics directly, as it offers better performance and supports clustered modes. Additionally, it is compatible with the Prometheus interface. However, there is less Chinese documentation available for VictoriaMetrics compared to Prometheus.
Single Node Testing Mode
To quickly test Nightingale, download the release package from Nightingale GitHub releases. After downloading, extract the package, and you will find a binary file named n9e. You can run it directly with ./n9e, which defaults to port 17000. The default username is root, and the password is root.2020.
The n9e process only relies on the etc and integrations directories in the same directory as the binary and does not depend on any other services.
In this single-node mode, it is convenient for quick testing but not recommended for production environments. In this mode, Nightingale stores configuration data (such as user information, alert rules, dashboards, etc.) in a local SQLite database file, so after starting the n9e process, a file named n9e.db will be generated in the same directory.
Single Node Production Mode
If you want to deploy Nightingale in a production environment, it requires dependencies on MySQL and Redis. Therefore, you need to configure the connection information for MySQL and Redis in the etc/config.toml file.
MySQL key configuration example:
[DB]
DBType = "mysql"
DSN = "root:YourPa55word@tcp(localhost:3306)/n9e_v6?charset=utf8mb4&parseTime=True&loc=Local"
In the above DSN (Data Source Name), the format is username:password@tcp(address:port)/database_name?parameters, where n9e_v6 is the name of the Nightingale database. Since version V6, this name has been consistently used (even though we are now at V8+), and it has been retained in the table creation statements.
Redis key configuration example:
[Redis]
Address = "127.0.0.1:6379"
RedisType = "standalone"
The above is just a basic configuration example. The configuration file contains many other configuration items, which can be referenced in the comments within the file or in the configuration file documentation.
Nightingale Cluster
The cluster mode is straightforward; you just need to set up multiple machines, deploy the n9e process on each machine (the process requires the etc and integrations directories to function properly), and ensure that the configuration files of all n9e processes are identical. They should share the same MySQL and Redis instances to work correctly.
Multiple n9e processes will automatically distribute alert rules. For example, if there are 2 n9e processes and users have configured a total of 100 alert rules, Nightingale will automatically assign these 100 alert rules to the 2 n9e processes, with each process handling approximately 50 alert rules (each rule will only run on one n9e instance, ensuring no duplicate alerts). If one machine goes down, the n9e process on the other machine will take over its alert rules and continue operating.
Edge Mode
The several modes mentioned above are all centralized modes. However, in actual production environments, there may be multiple computer rooms, and the network quality between the central computer room and edge computer rooms may be poor. If the n9e in the central computer room is made responsible for alerting on a time-series database in an edge computer room, it will be unstable, and sometimes n9e may even fail to connect directly to the time-series database in the edge computer room. In such cases, Nightingale’s edge mode is required.
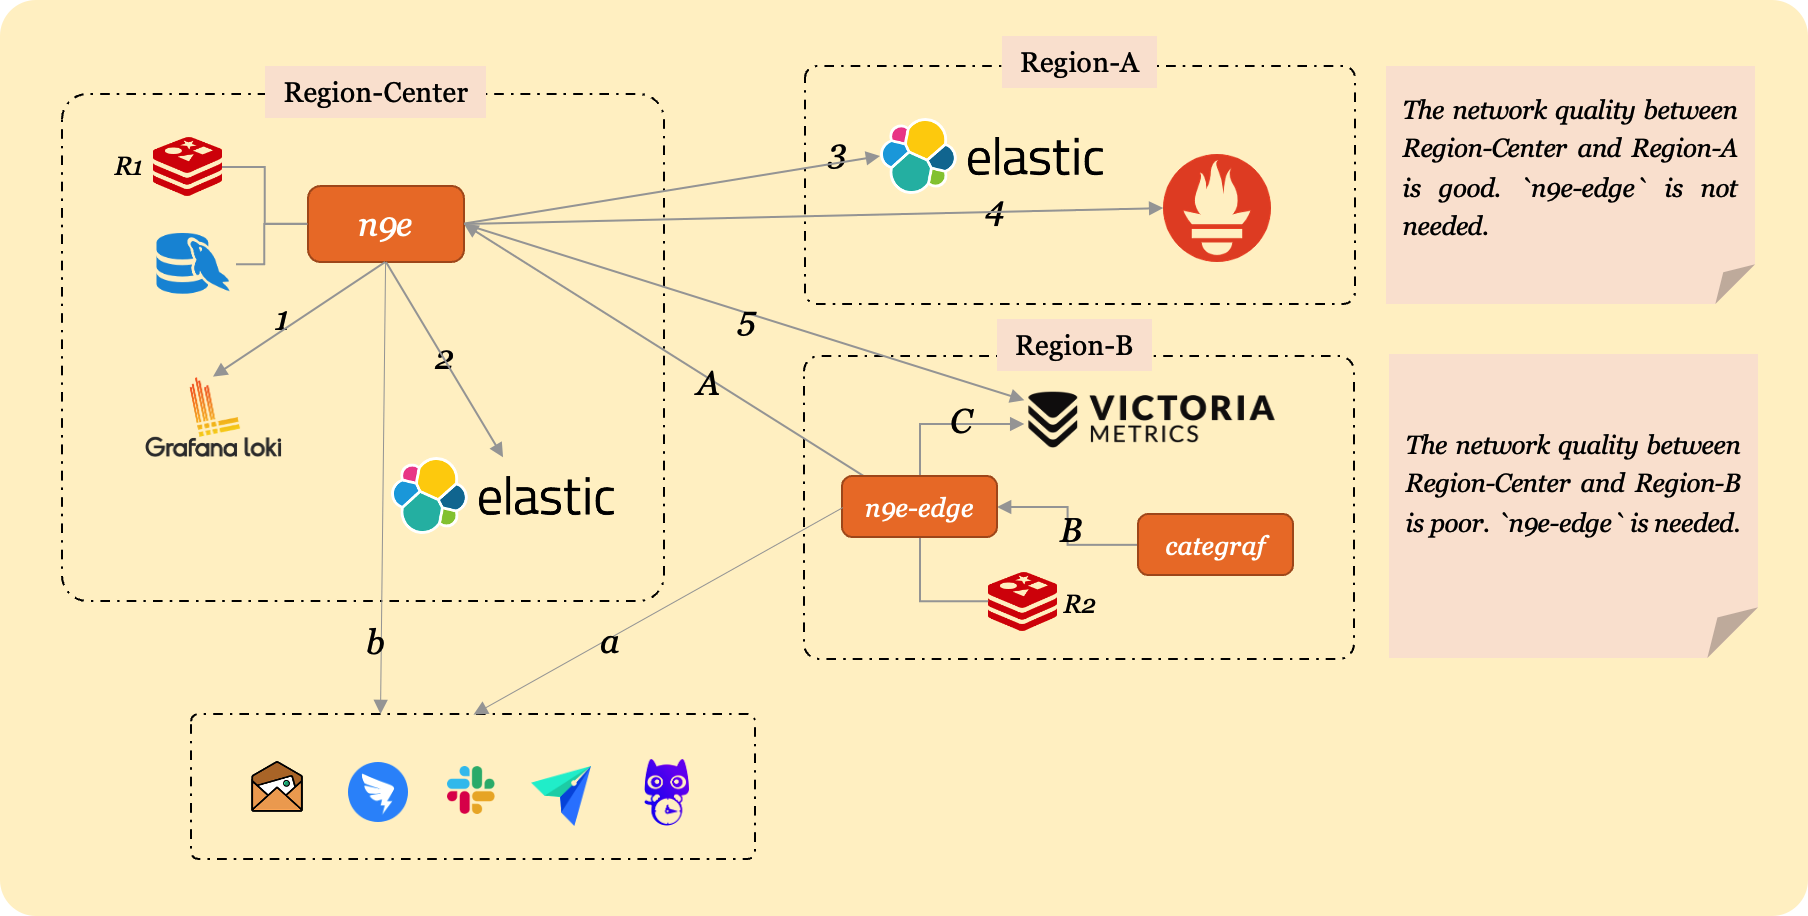
Assume your company has 3 data centers: a central primary data center, edge data center A, and edge data center B. A has a dedicated line to the central facility with good network quality, while B uses public network with unreliable connectivity.
The n9e process is deployed in the central data center, along with its dependencies MySQL and Redis. For high availability, deploy multiple central n9e instances with identical configurations connecting to the same MySQL and Redis.
In the diagram, there are 5 data sources:
- Central data center: Loki and ElasticSearch
- Edge A: ElasticSearch and Prometheus
- Edge B: VictoriaMetrics
To uniformly view data from all 5 sources in the central n9e, configure their access addresses in Nightingale via Integrations - Data sources.
The central n9e can directly access data sources in the central and edge A facilities via internal addresses but cannot reach edge B’s VictoriaMetrics (no dedicated line). Thus, expose edge B’s VictoriaMetrics via a public address for central n9e access:
- Expose edge B’s VictoriaMetrics at a public address (e.g., https://ex.a.com)
- Configure this public URL in Nightingale’s web UI for edge B’s VictoriaMetrics
Lines 1-5 in the diagram represent connections between the central n9e and the 5 data sources. When users query data via Nightingale’s web interface, requests are proxied through the n9e process to backend data sources, which return results to the user.
n9e-edge is deployed in edge B to handle alert evaluations for its VictoriaMetrics. It synchronizes alert rules from the central n9e (line A in the diagram), caches them in memory, and evaluates alerts against the local VictoriaMetrics. This ensures reliable alerting as n9e-edge and VictoriaMetrics are internally connected. Even if n9e-edge loses connectivity to the central n9e, alert evaluation continues using cached rules.
Alert events generated by n9e-edge are written to the central MySQL via n9e’s API and sent to notification services (DingTalk, Feishu, FlashDuty, etc.). If network connectivity between n9e-edge and n9e fails, events cannot be written to MySQL, but notifications can still be sent if the edge facility has external network access.
In the architecture:
- Central
n9ehandles alert evaluation for central Loki/ElasticSearch and edge A’s ElasticSearch/Prometheus - Edge B’s
n9e-edgehandles alert evaluation for its VictoriaMetrics
To associate data sources with specific alert engines, configure this in the data source management page:
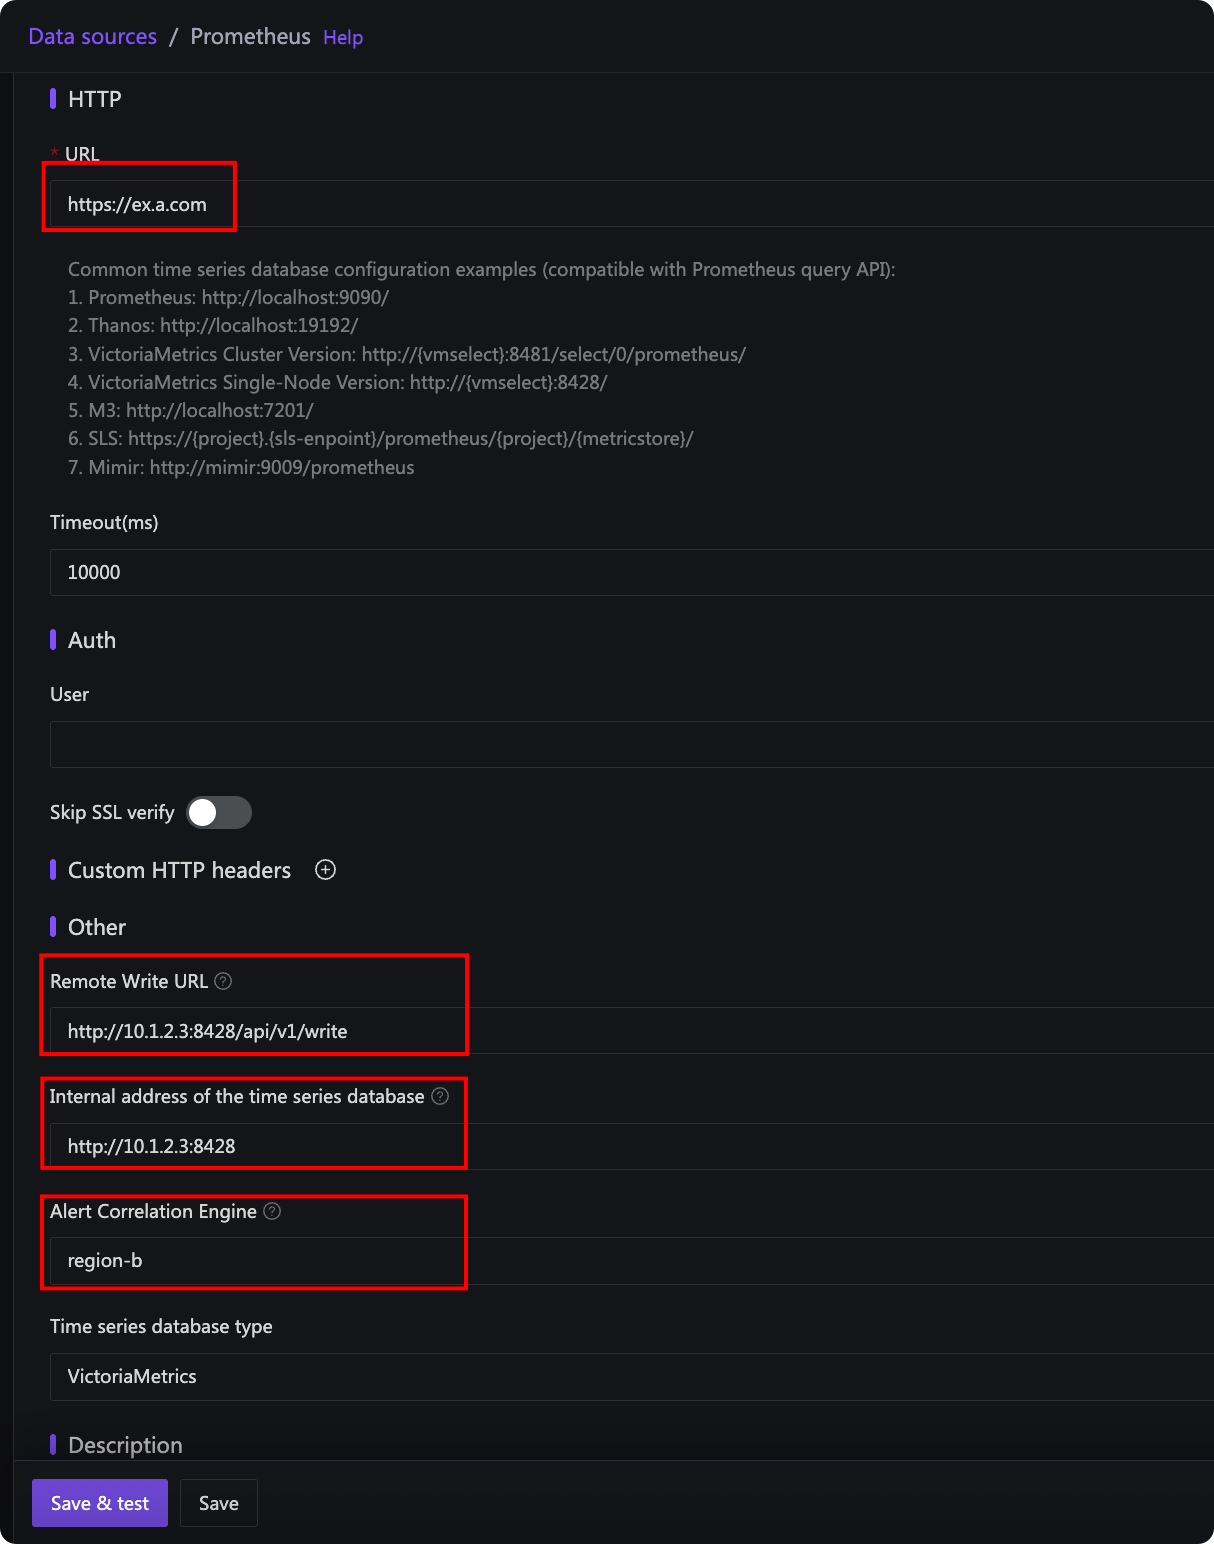
In the diagram:
- URL: Address used by central
n9eto read data (public address for edge B’s VictoriaMetrics in the example) - Time-series Database Intranet Address: Address used by
n9e-edgeto connect to VictoriaMetrics. Leave blank to use the URL if it’s already an internal address. For edge B, configure an internal address for reliable alert evaluation. - Remote Write URL: VictoriaMetrics’ remote write address for recording rules.
n9e-edgeprocesses recording rules and writes results back to the time-series database, so use an internal address. Optional if recording rules are unused. - Associated Alert Engine Cluster: Selected as “edge-b” (name specified by
EngineNameinedge.toml), establishing the association between edge B’sn9e-edgeand its VictoriaMetrics for handling alert/recording rules.
Newer Nightingale versions require n9e-edge to use a dedicated Redis instance in edge B, separate from the central n9e’s Redis (labeled R1 and R2 in the diagram).
For Categraf: if network connectivity is good (central and edge A), Categraf can report directly to the central n9e. For edge B with n9e-edge, configure Categraf to connect to the local n9e-edge.
Configuration Examples
Sample configurations for the above architecture:
Central n9e Configuration
The central n9e uses etc/config.toml:
[HTTP.APIForService]
Enable = true
[HTTP.APIForService.BasicAuth]
user001 = "ccc26da7b9aba533cbb263a36c07dcc5"
user002 = "ccc26da7b9aba533cbb263a36c07dcc6"
Key configuration: HTTP.APIForService. Default Enable = false (security measure). Set to true to support n9e-edge. n9e-edge uses BasicAuth for authentication (configured above with two users for demonstration). If n9e is exposed publicly, modify default passwords to prevent attacks.
Edge n9e-edge Configuration
n9e-edge uses etc/edge/edge.toml. Configure the central n9e address for rule synchronization:
[CenterApi]
Addrs = ["http://N9E-CENTER-SERVER:17000"]
BasicAuthUser = "user001"
BasicAuthPass = "ccc26da7b9aba533cbb263a36c07dcc5"
# unit: ms
Timeout = 9000
N9E-CENTER-SERVER:17000 is the central n9e address. BasicAuthUser and BasicAuthPass match central credentials (omit if BasicAuth is disabled). Always modify default passwords for public exposure.
New n9e-edge versions require Redis (configure in edge.toml). Check for Redis settings in the default edge.toml to confirm dependency.
Edge Categraf Configuration
Configure writer and heartbeat addresses to point to n9e-edge:
...
[[writers]]
url = "http://N9E-EDGE:19000/prometheus/v1/write"

...
[heartbeat]
enable = true

# report os version cpu.util mem.util metadata
url = "http://N9E-EDGE:19000/v1/n9e/heartbeat"
...
N9E-EDGE:19000 is the n9e-edge address (default port 19000, configurable in edge.toml).
Ibex Configuration
For self-healing functionality (ibex), enable in edge.toml:
[Ibex]
Enable = true
RPCListen = "0.0.0.0:20090"
Configure edge Categraf to connect to n9e-edge’s RPC port:
[ibex]
enable = true
## ibex flush interval
interval = "1000ms"
## n9e ibex server rpc address
servers = ["N9E-EDGE-IP:20090"]
## temp script dir
meta_dir = "./meta"
N9E-EDGE-IP:20090 is the n9e-edge RPC address (no http:// prefix for RPC).
Other Use Cases
Beyond poor network links, edge mode suits secure network partitions where only a relay machine connects to the central n9e. Deploy n9e-edge on the relay, with other machines’ Categraf instances connecting to it.