Introduction
Nightingale is an open-source project focused on alerting. Similar to Grafana’s data source integration approach, Nightingale also integrates with various existing data sources. While Grafana focuses on visualization, Nightingale focuses on alerting.
Nightingale can query data from multiple data sources, generate alarm events, and then send alerts via various notification channels. In addition, we also have an event pipeline design, which can perform different processing on alarm events, such as filtering, relabeling, enriching, and so on.
Repo
- Backend: https://github.com/ccfos/nightingale
- Frontend: https://github.com/n9e/fe
Any issues or PRs are welcome!
Working logic
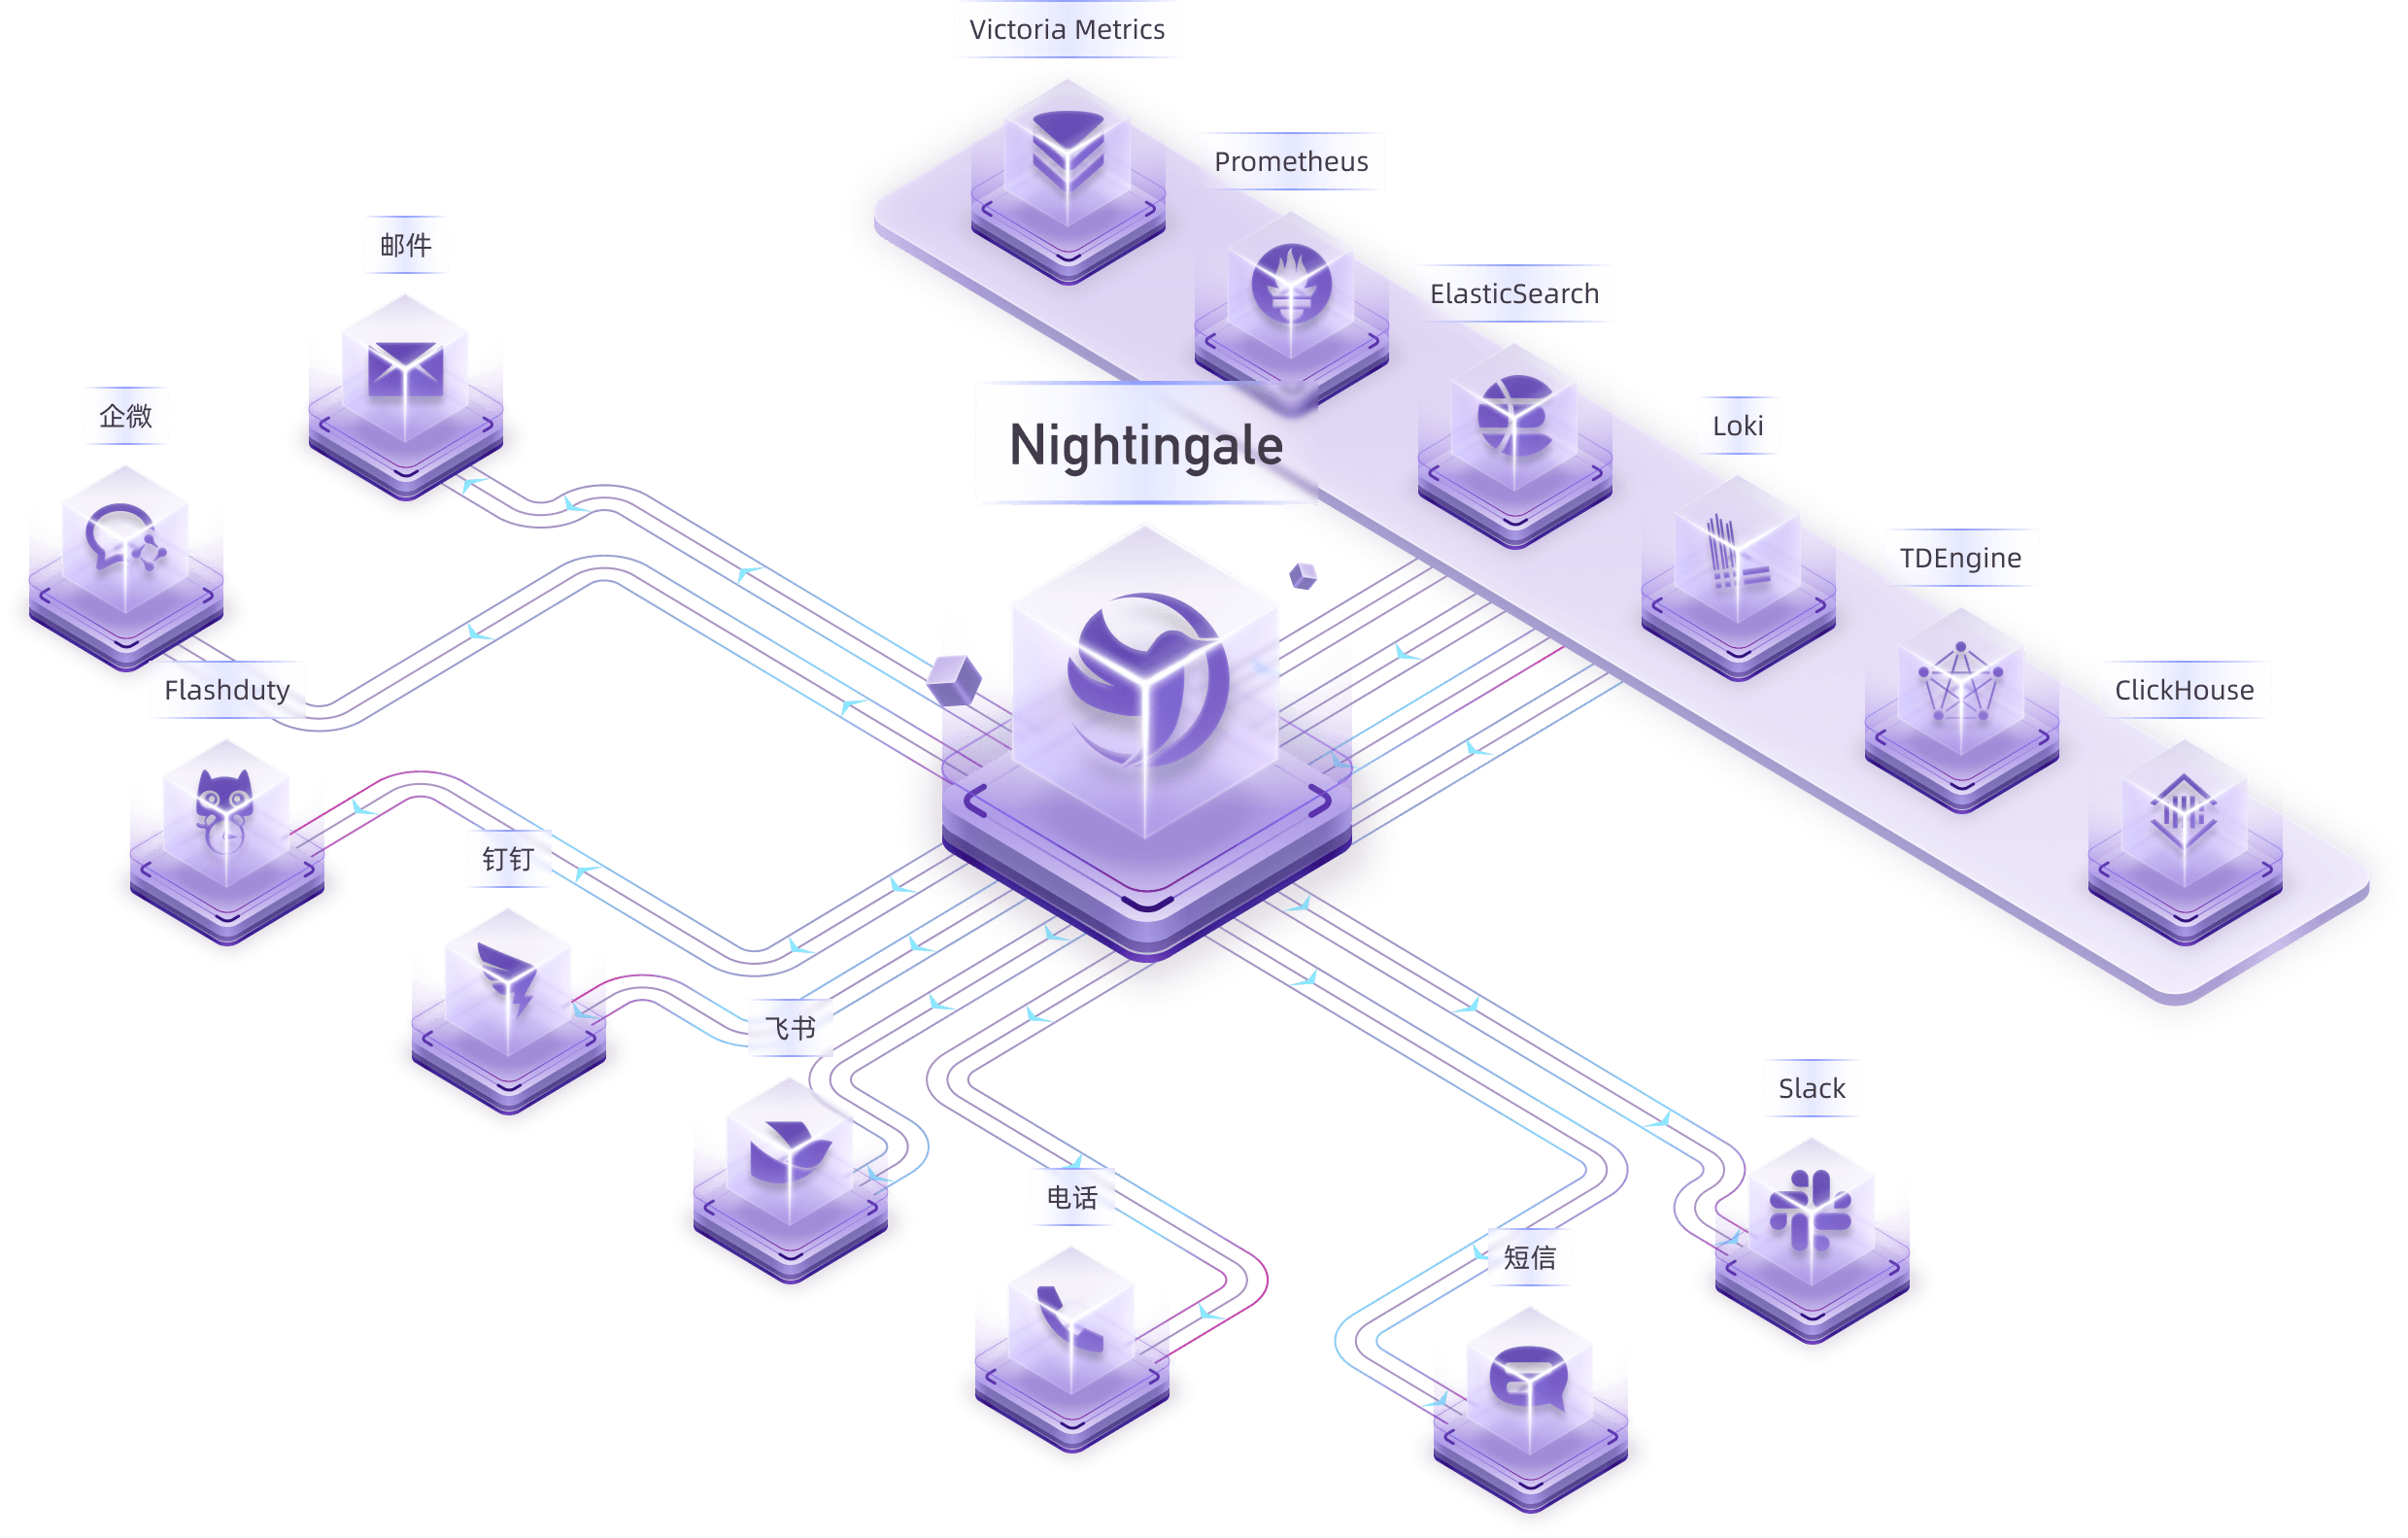
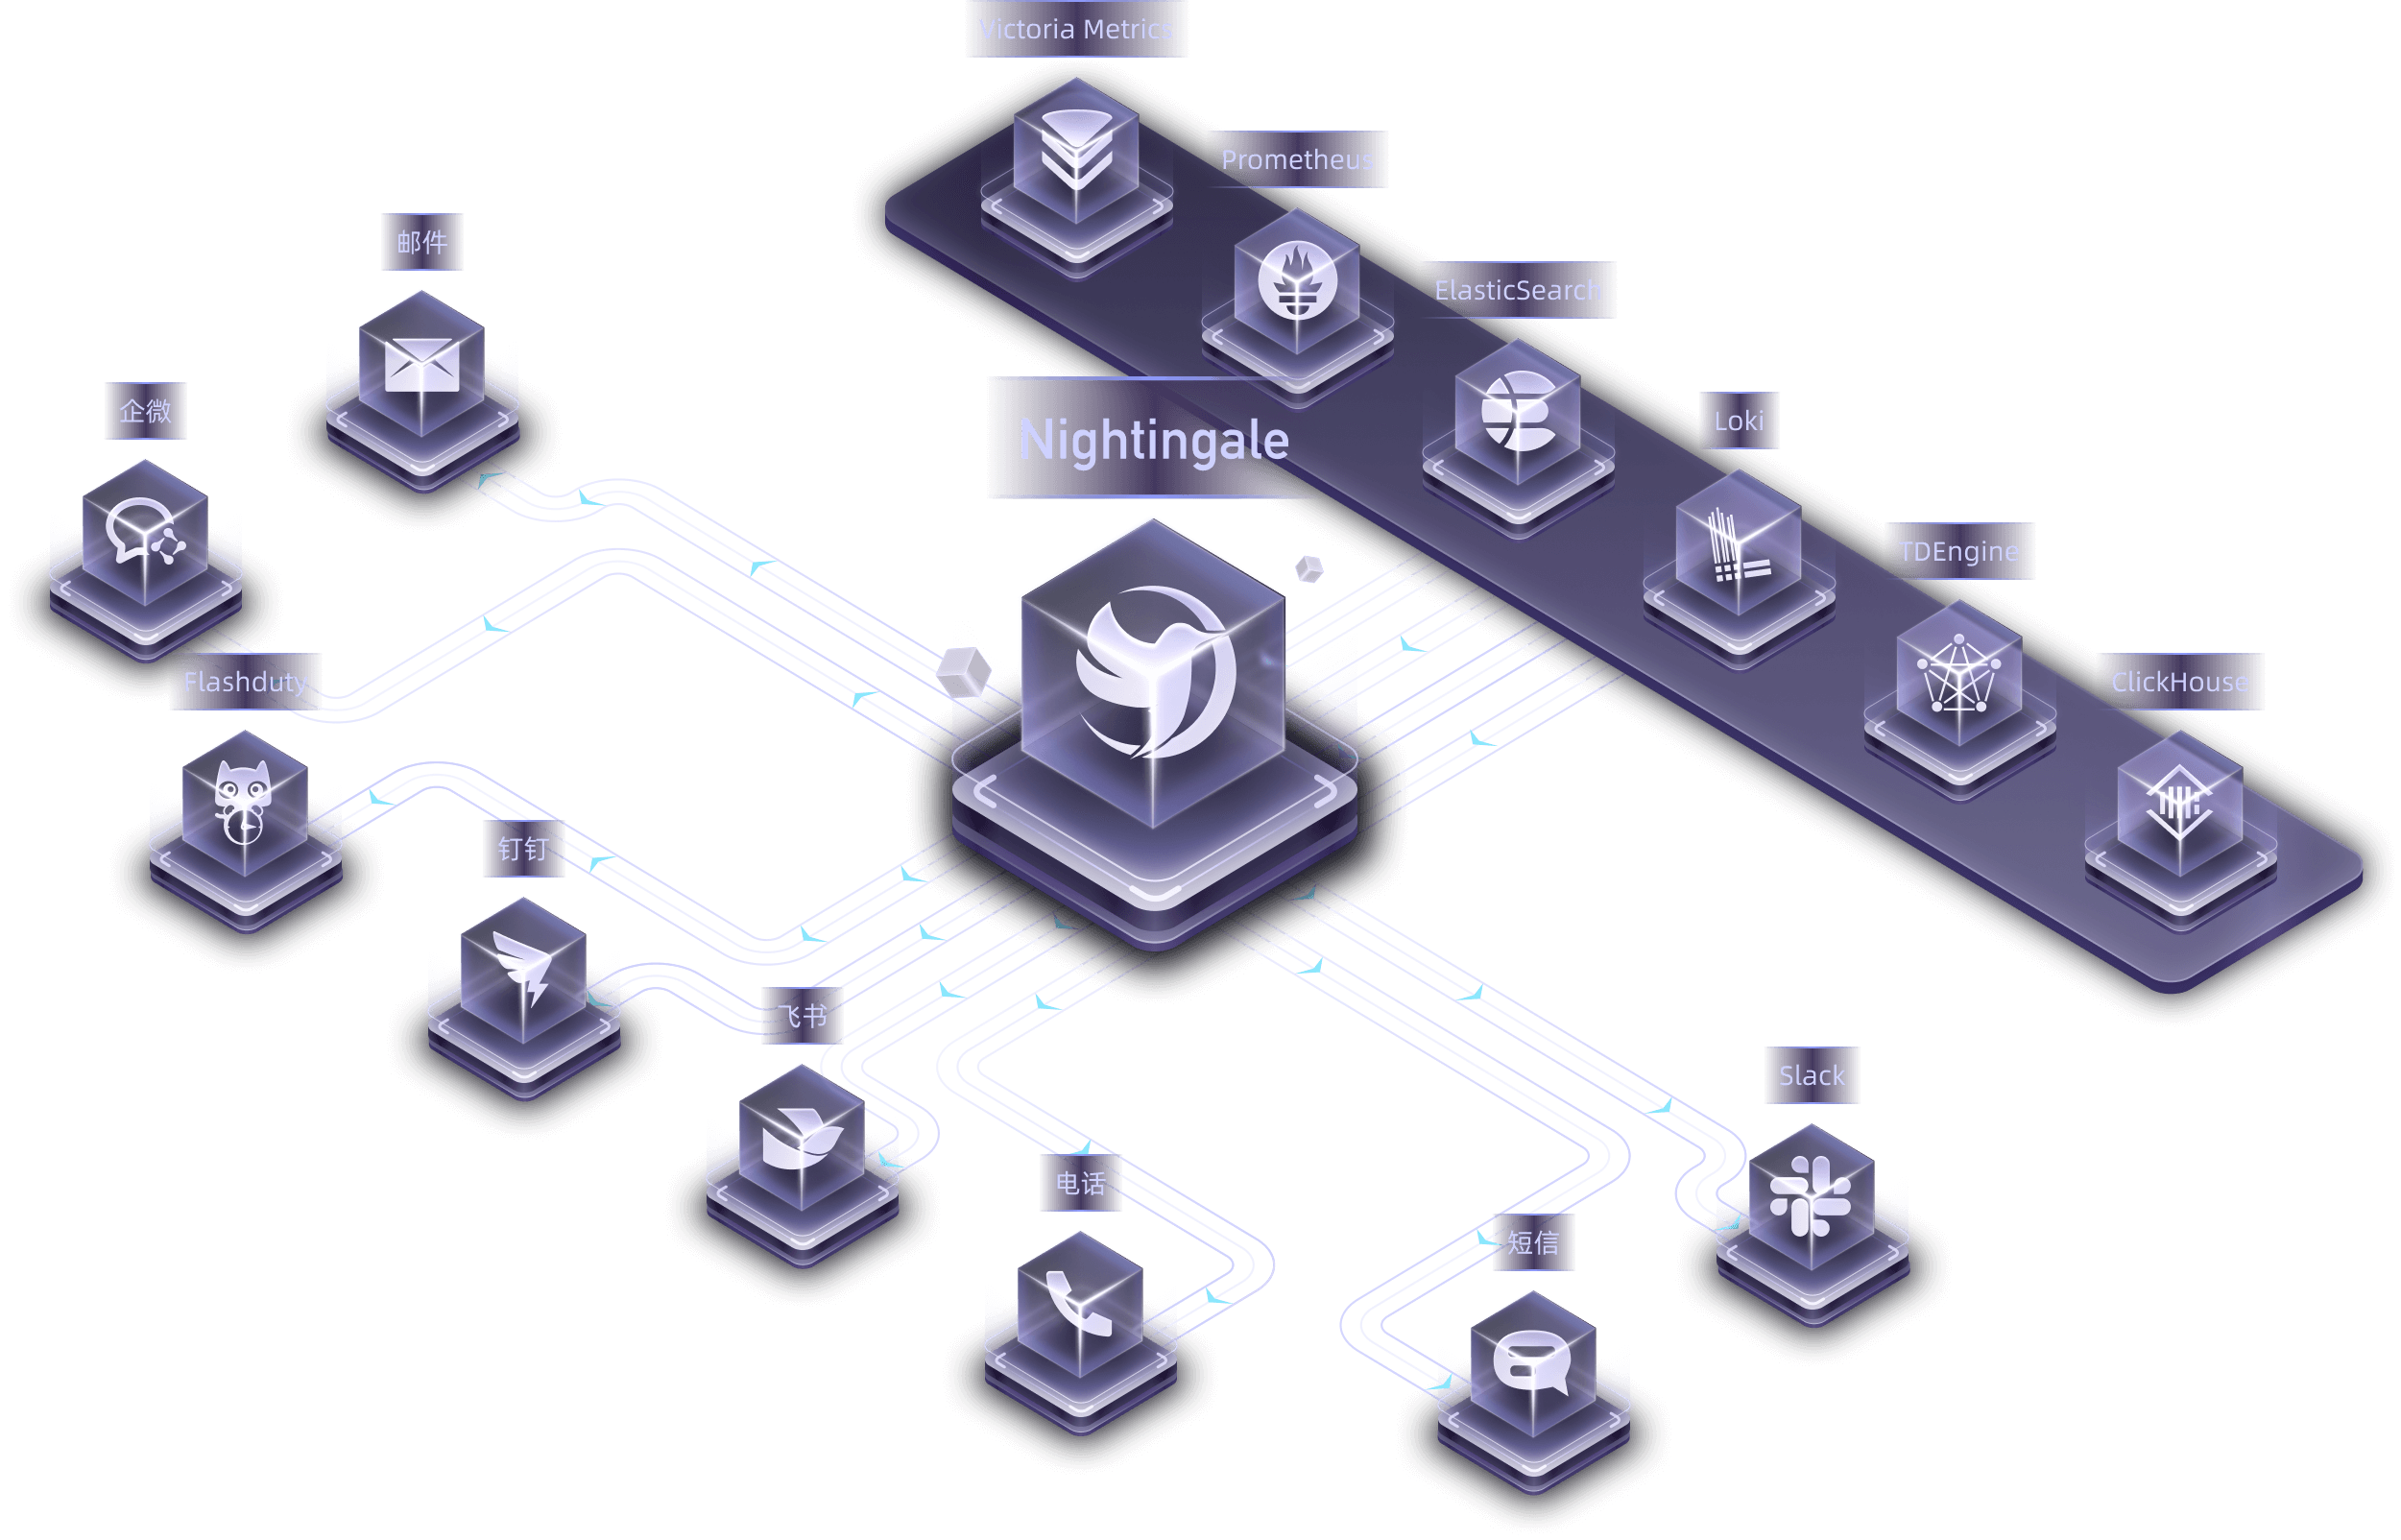
Many users have already collected metrics and log data themselves. In this case, they can integrate their storage repositories (like VictoriaMetrics, Elasticsearch, etc.) as data sources in Nightingale. Users can then configure alert rules and notification rules in Nightingale to generate and dispatch alert events.
Nightingale itself does not provide data collection capabilities. We recommend using Categraf as a collector, which can seamlessly integrate with Nightingale.
Categraf can collect monitoring data from operating systems, network devices, middleware, and databases. It pushes this data to Nightingale (via Prometheus Remote Write protocol), which then forwards the data to time-series databases (like Prometheus, VictoriaMetrics, etc.) and provides alerting and visualization capabilities.
For specific edge data centers, where the network link to the central Nightingale server is poor, Nightingale also provides a design for edge data center alerting engine deployment. In this mode, even if the edge and central networks are disconnected, alerting functionality remains unaffected.
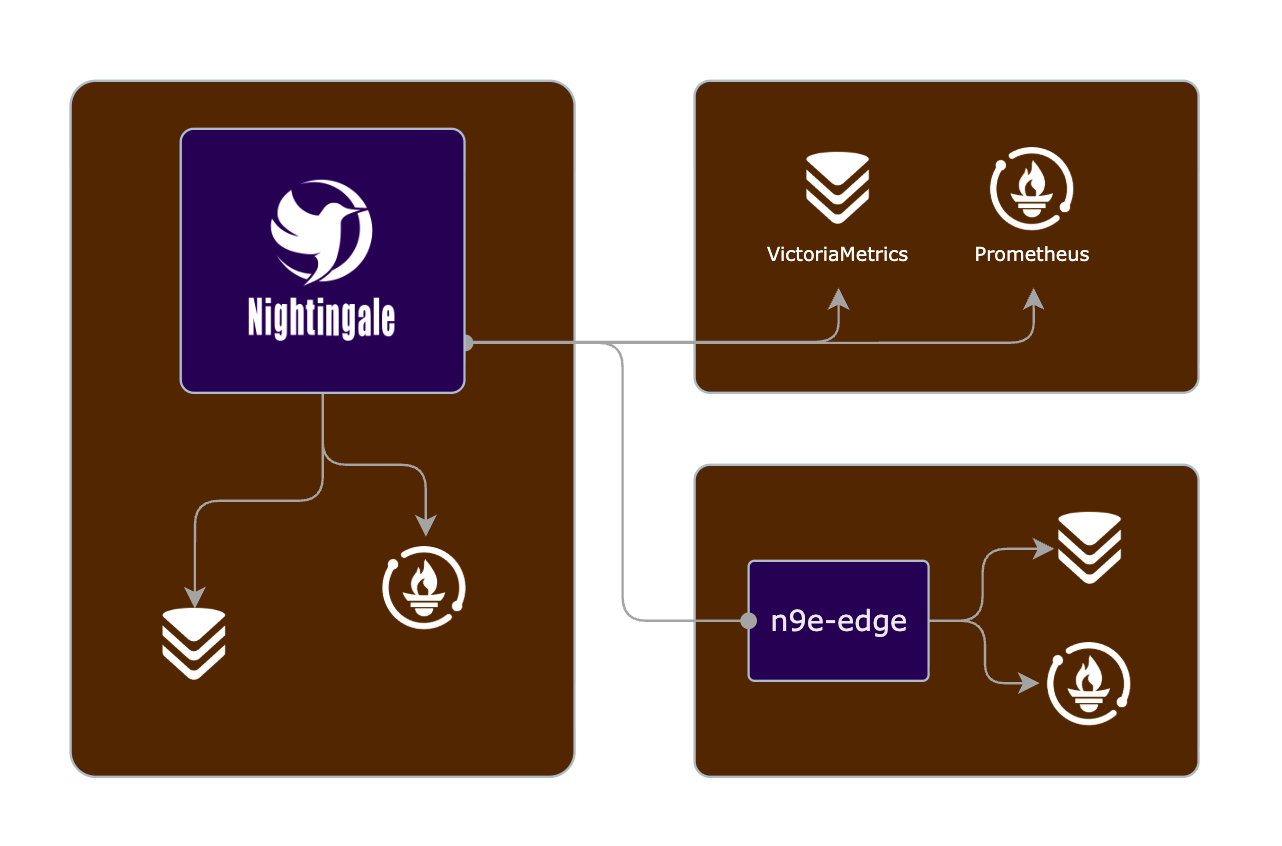
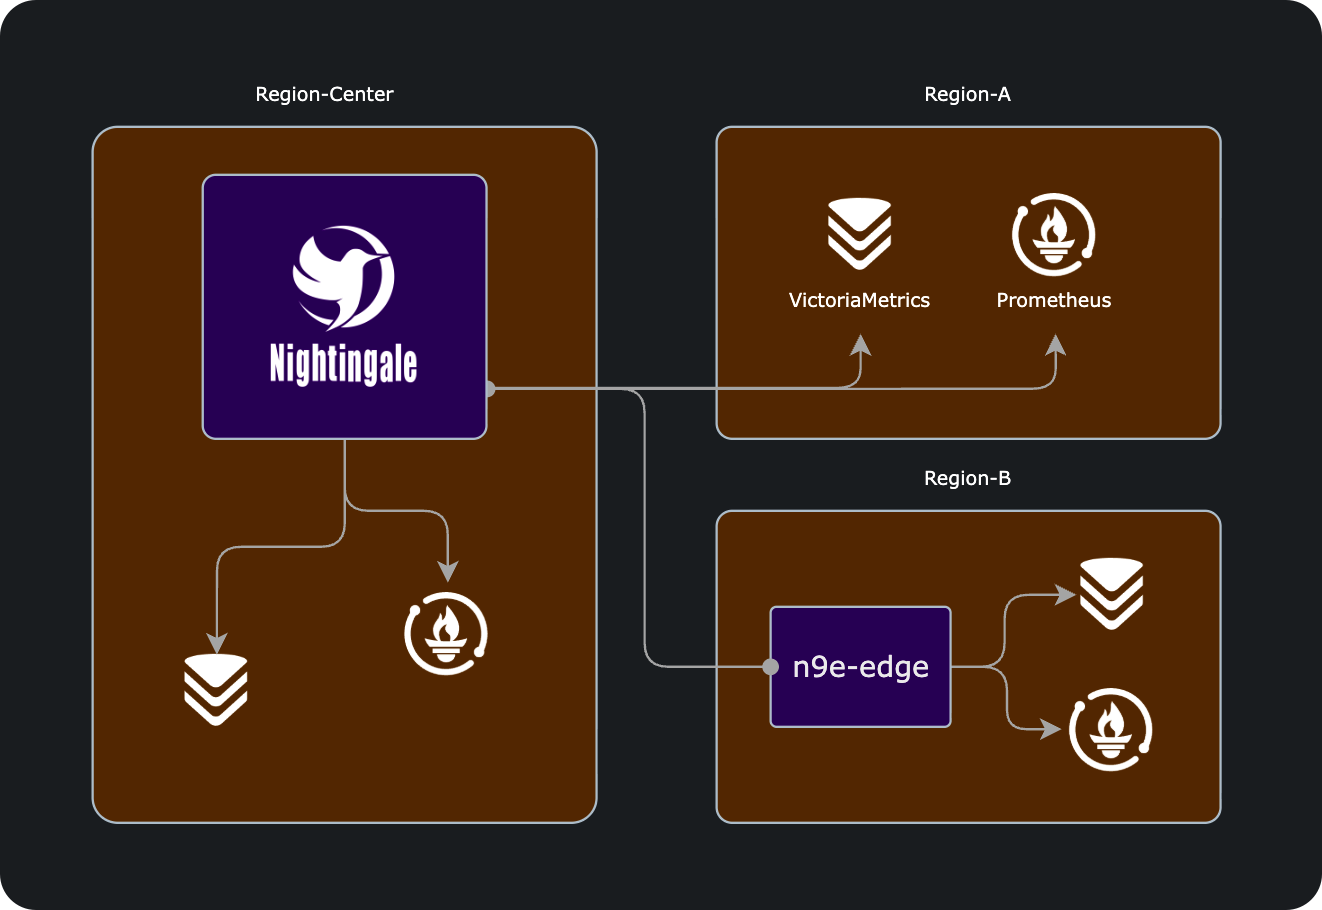
In the above diagram, the network link between data center A and the central data center is good, so the alerting engine is handled by the central Nightingale process. For data center B, where the network link to the central data center is poor, we deploy
n9e-edgeas the alerting engine to handle data source alerting functionality locally.
Alerting, Upgrades, and Collaboration
Nightingale focuses on being an alerting engine, responsible for generating alert events and flexibly dispatching them based on rules. It has built-in support for 20 notification channels (like phone calls, SMS, email, DingTalk, Feishu, WeCom, Slack, etc.).
If you have more advanced requirements, such as:
- Want to aggregate events from multiple monitoring systems into one platform for unified noise reduction, response handling, and data analysis
- Want to support team on-call culture, including features like alert claim, escalation (to avoid missing alerts), and collaborative handling
Then Nightingale may not be suitable. We recommend using FlashDuty, an on-call product that aggregates alerts from various monitoring systems for unified noise reduction, distribution, and response.
Key Capabilities

- Nightingale supports alert rules, muting rules, subscription rules, and notification rules. It natively integrates 20 notification channels and allows customization of message templates.
- Nightingale supports event pipelines to process alert events and integrate with third-party systems. For example, it can perform operations like relabeling, filtering, and enriching on events.
- Nightingale supports the concept of business groups and introduces a permission system to manage various rules in a categorized manner.
- Many databases and middleware have built-in alert rules that can be directly imported for use, and Prometheus alert rules can also be directly imported.
- Nightingale supports alert self-healing, which means that after an alert is triggered, a script is automatically executed to perform some predefined logic, such as cleaning up the disk or capturing the on-site situation.

- Nightingale archives historical alert events and supports multi-dimensional querying and statistics.
- It allows flexible aggregation and grouping, making it easy to get a clear overview of the distribution of the company’s alert events at a glance.

- Nightingale has built-in metric explanations, dashboards, and alert rules for common operating systems, middleware, and databases. However, these are all contributed by the community, and their overall quality varies.
- Nightingale directly receives data from multiple protocols such as Remote Write, OpenTSDB, Datadog, and Falcon, thus enabling integration with various types of agents.
- Nightingale supports multiple data sources including Prometheus, ElasticSearch, Loki, and TDEngine, and can perform alerting based on the data from them.
- Nightingale can be easily embedded into internal enterprise systems, such as Grafana and CMDB. It even allows configuring the menu visibility of these embedded systems.

- Nightingale supports dashboard functionality, featuring common chart types and some built-in dashboards. The image above is a screenshot of one of these dashboards.
- If you’re already accustomed to Grafana, it’s recommended to continue using Grafana for viewing charts, as Grafana has more profound expertise in this area.
- For machine-related monitoring data collected by Categraf, it’s advisable to use Nightingale’s built-in dashboards. This is because Categraf’s metric naming follows Telegraf’s naming convention, which differs from that of Node Exporter.
- Since Nightingale incorporates the concept of business groups, where machines can belong to different business groups, there are times when you may only want to view machines belonging to the current business group in the dashboard. Therefore, Nightingale’s dashboards can be linked with business groups.
Thank you for the trust from numerous enterprises.
Nightingale has been adopted by many enterprises, including but not limited to:
Open Source License
The Nightingale monitoring project is open-sourced under the Apache License 2.0.