Ad-hoc Query
Nightingale supports Ad-hoc queries, enabling direct querying of data from data sources through the interface. The menu entry is under Explorer; select Metrics to query metric data and Logs to query log data.
Metric Query
Here is an example of a metric query:
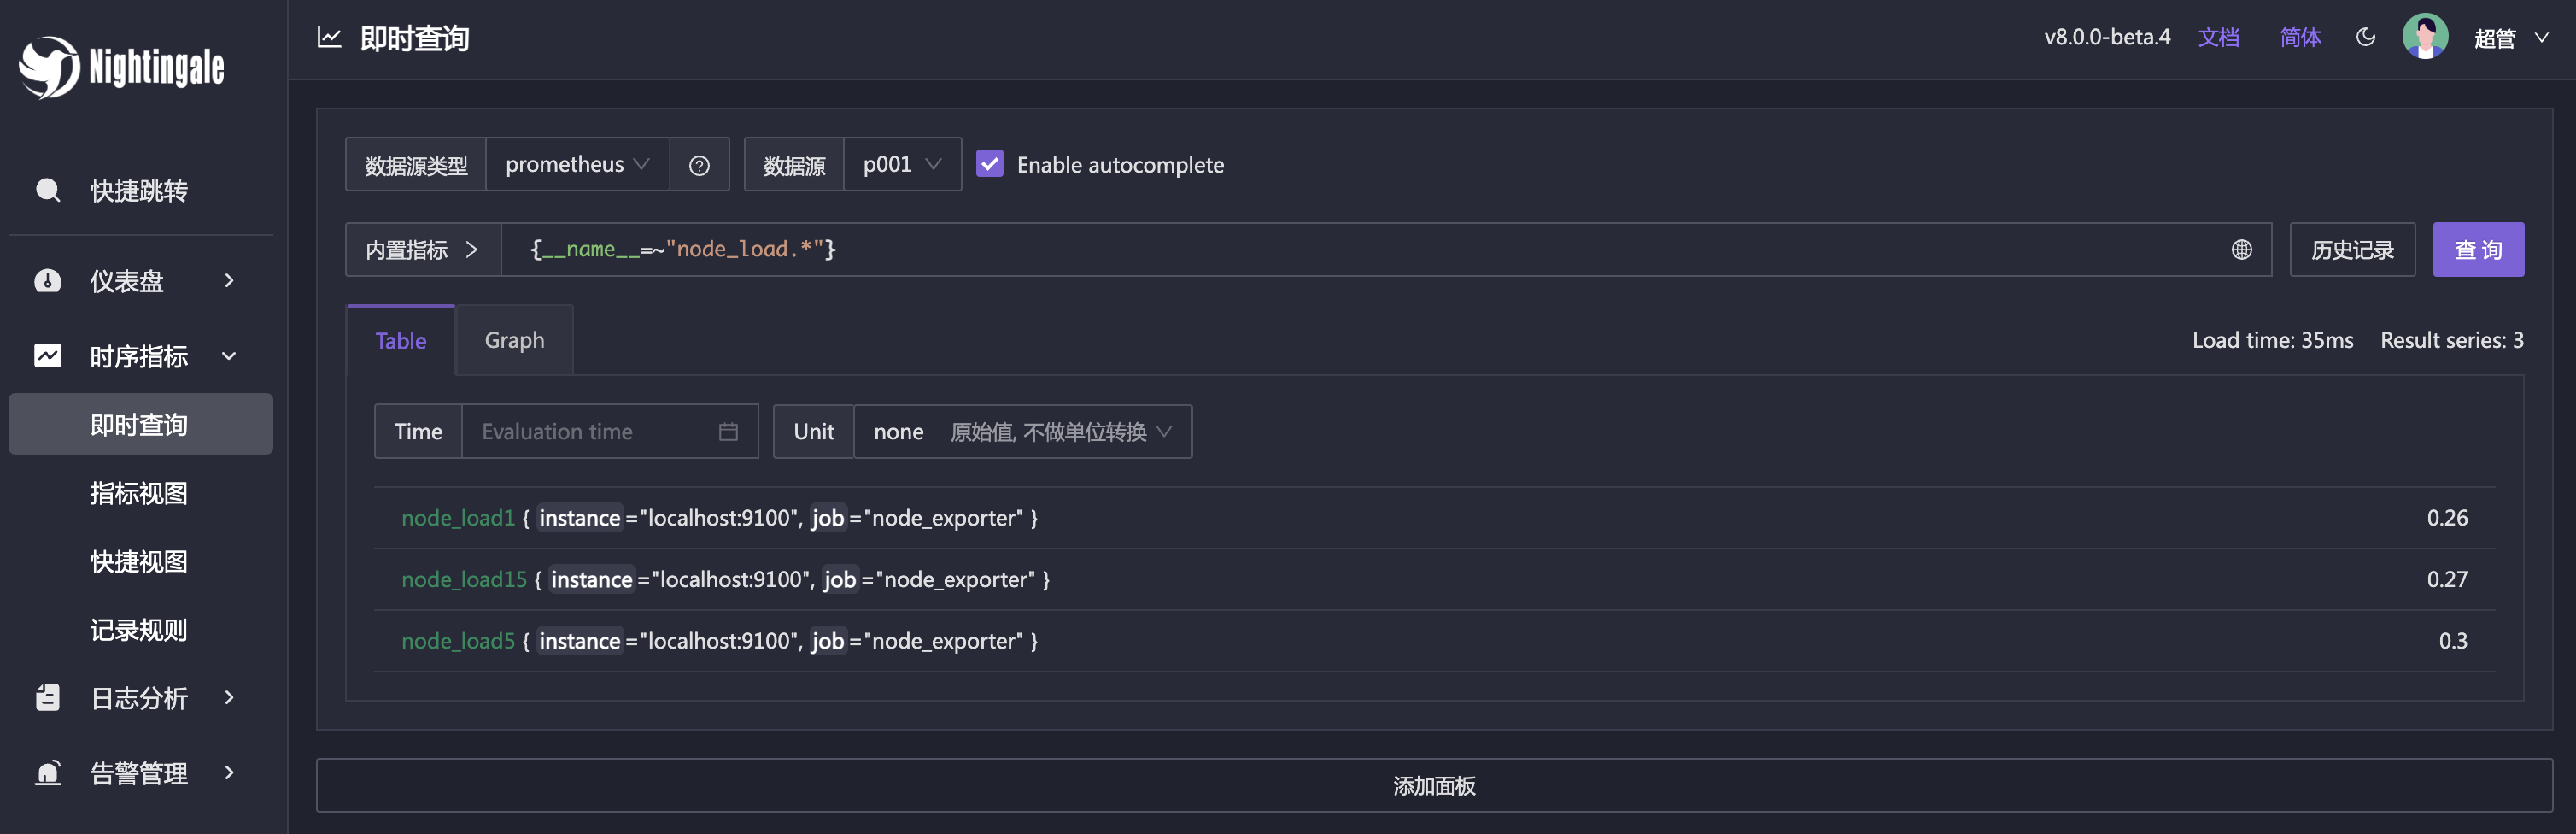
This page is similar to Prometheus’ graph page, supporting queries for time-series metric data. Of course, some enhancements have been made, such as adding built-in metrics, history records, and other capabilities. In the above image, it is a range vector using the Table view. Nightingale will perform an additional step here to calculate the time difference between each piece of data, which is the +15 on the far right. This helps in troubleshooting data loss issues. For example, if most time differences are regular and consistent with the collection frequency, but suddenly there are two larger time differences that are several times the collection frequency, it indicates a failure in data collection or transmission.
A common question from new users is why no data is visible when first entering this page. This is expected; you need to enter a PromQL query first to see the data, rather than seeing data immediately upon entering. PromQL is a prerequisite for using Prometheus and Nightingale. It is recommended to learn the basics of PromQL first. For reference materials, see: 《Promql Series Tutorials》
If you are using Categraf as the collector, you can query the cpu_usage_active metric. If it can be found, the data source configuration is correct. If you are using Node-Exporter as the collector, you can query the node_load1 metric. If it can be found, the data source configuration is correct.
Log Query
Log queries mainly support ElasticSearch data sources. When configuring an ElasticSearch data source, many people are confused about the version field. If you are using ElasticSearch 6.x, select 6.0+; if using 7.x, select 7.0+; for higher versions, also select 7.0+. If you encounter compatibility issues, please submit issues for feedback.
After configuring the data source, you can query logs on the Explorer - Logs page. Here is an example of a log query:
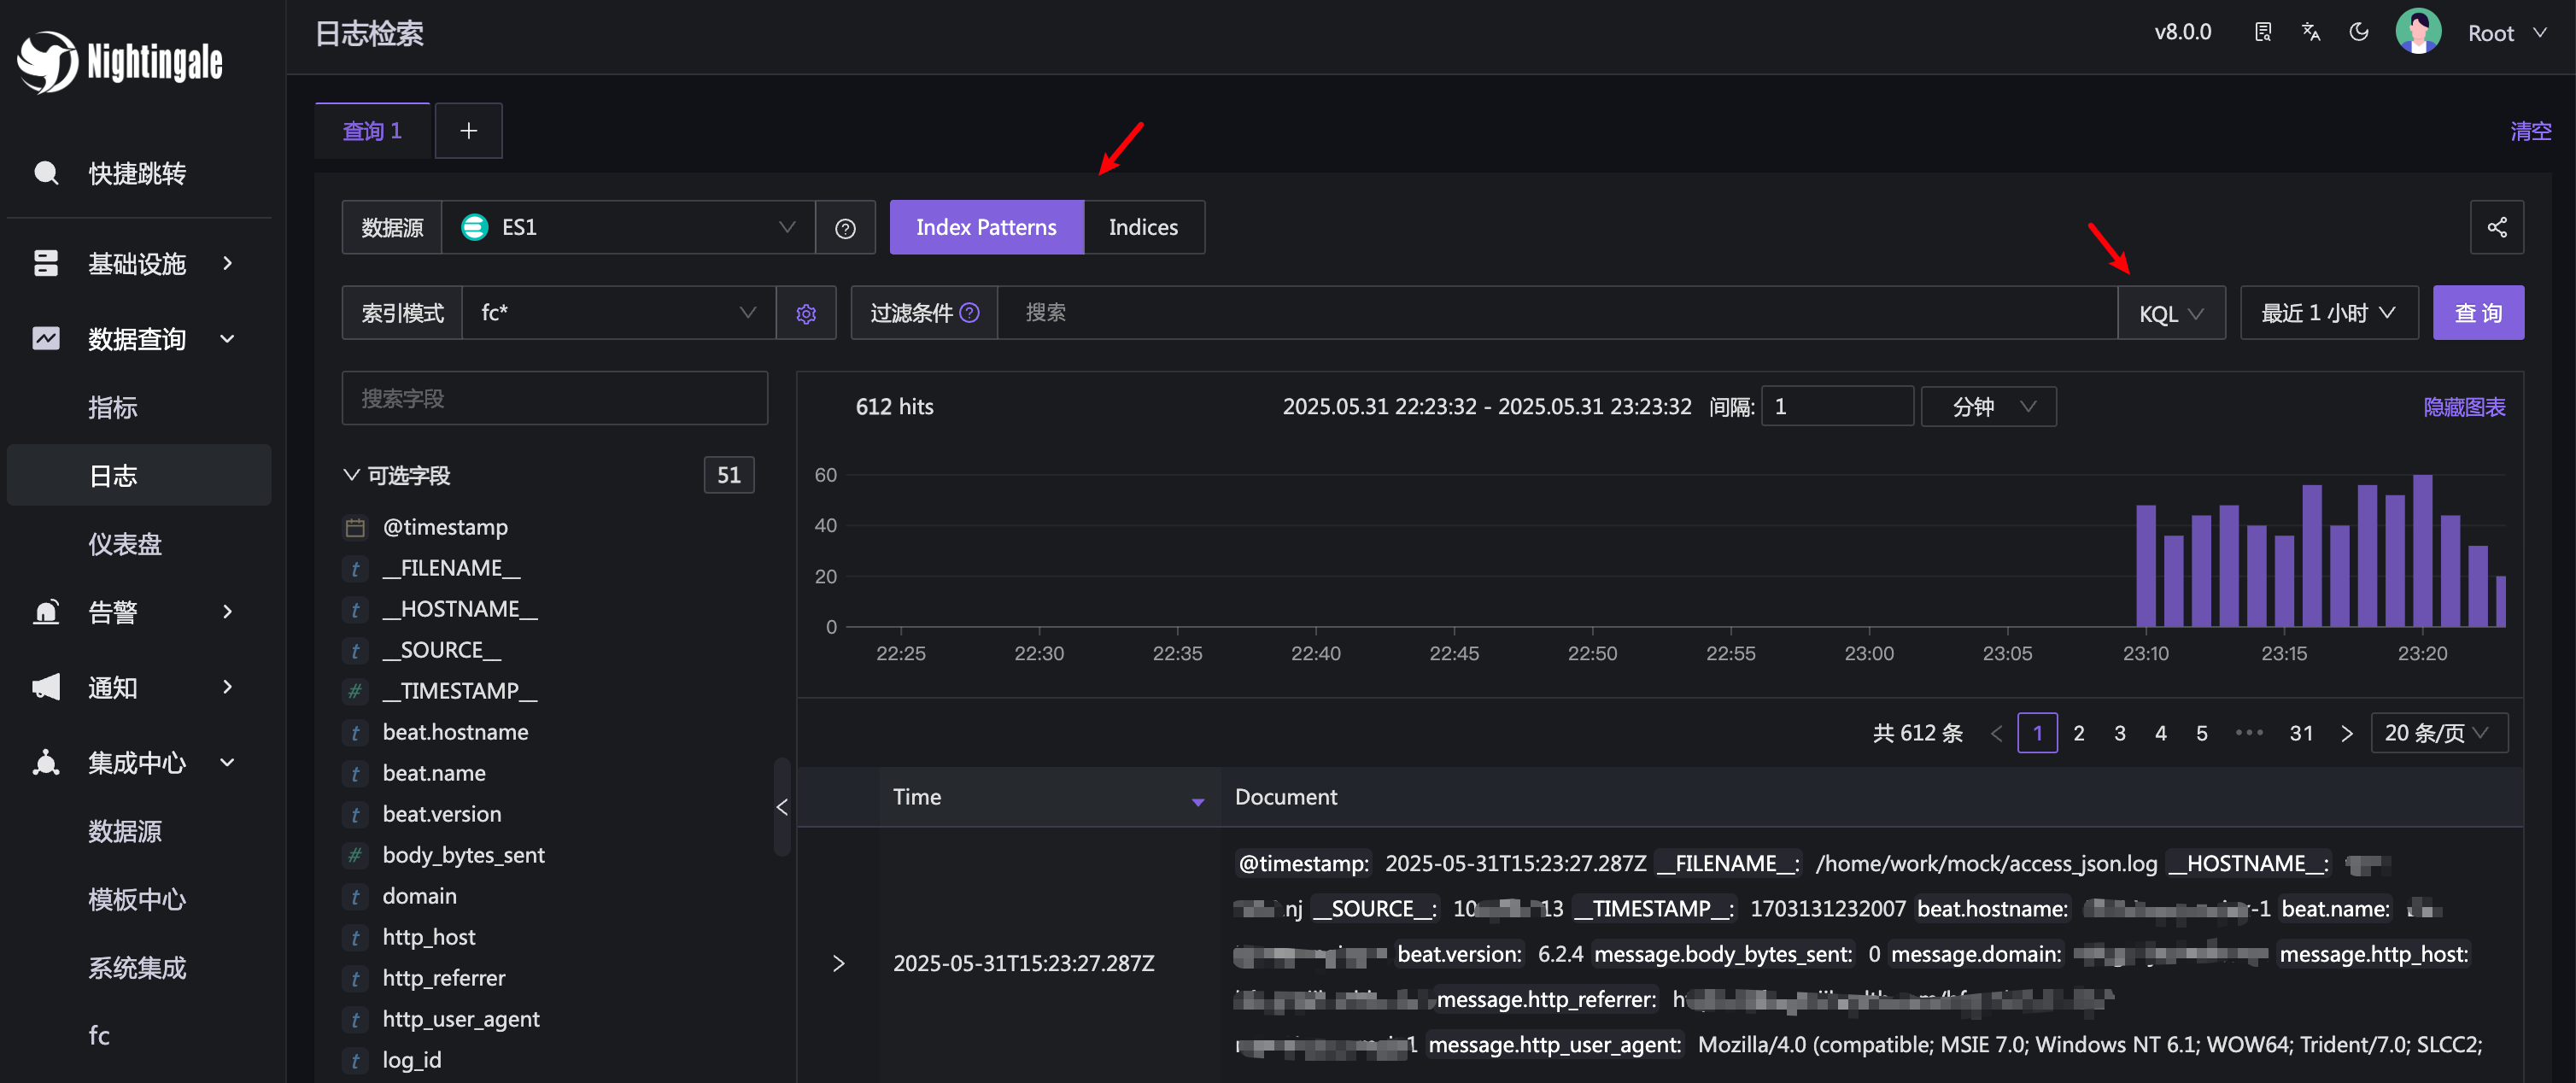
Similar to Kibana’s log query page, Nightingale supports querying by index pattern or directly querying indexes (with wildcard support) without creating an index pattern. However, directly querying indexes is not a good practice and this feature may be removed in the future. Additionally, the query syntax supports both KQL and Lucene (i.e., query string). For ElasticSearch users, these concepts are familiar, so they will not be elaborated here.
After successfully configuring the data source, the next step is to configure alert rules and experience Nightingale’s alert engine capabilities.