Dashboard
Although Nightingale monitoring focuses on alerting, it also supports dashboard functionality. While it may not be as sophisticated as Grafana, it supports common chart types and can meet daily usage needs.
Quick Import
We have previously organized machine dashboards that you can directly import to quickly see the effects. The import method:
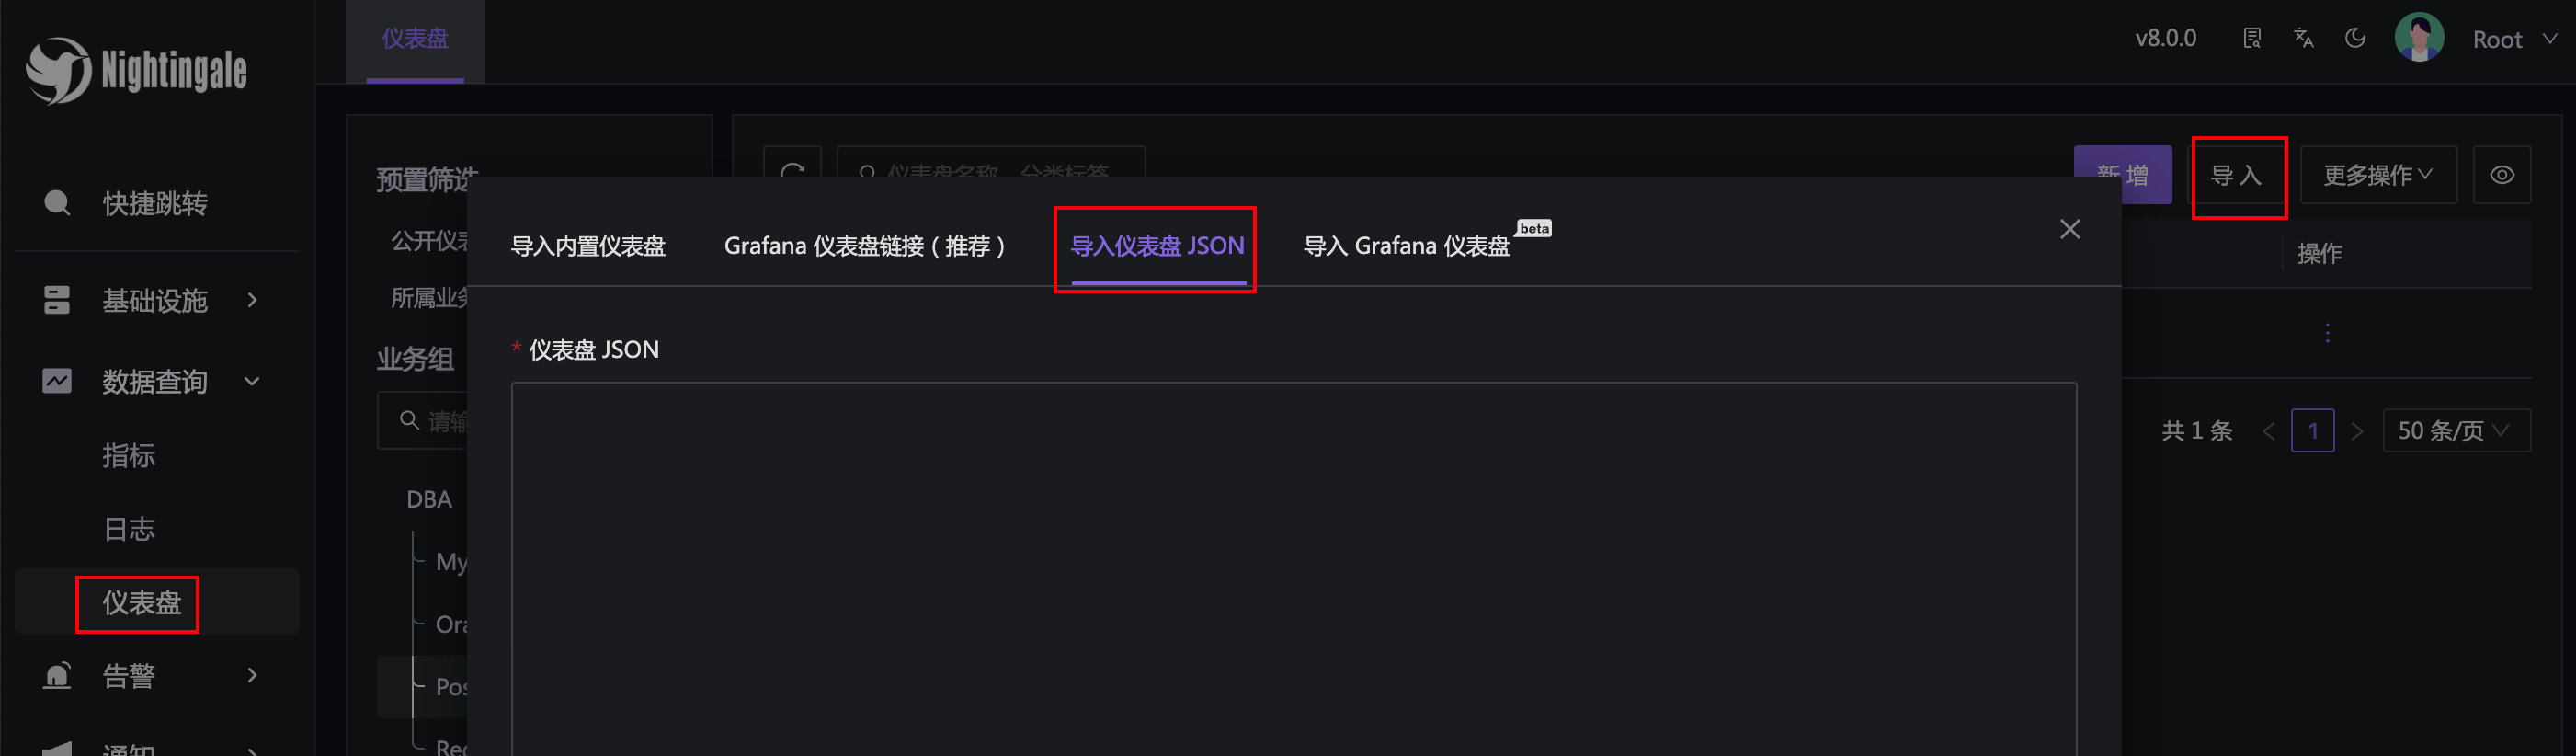
Different collectors collect monitoring metrics with different names and labels, so separate dashboards need to be created for each. If you are using Categraf, you can import the following two dashboards:
- Machine overview data: categraf-overview.json
- Machine detailed data: categraf-detail.json
If you are using Node Exporter, you can import the following dashboard:
- Node key metrics: exporter-detail.json
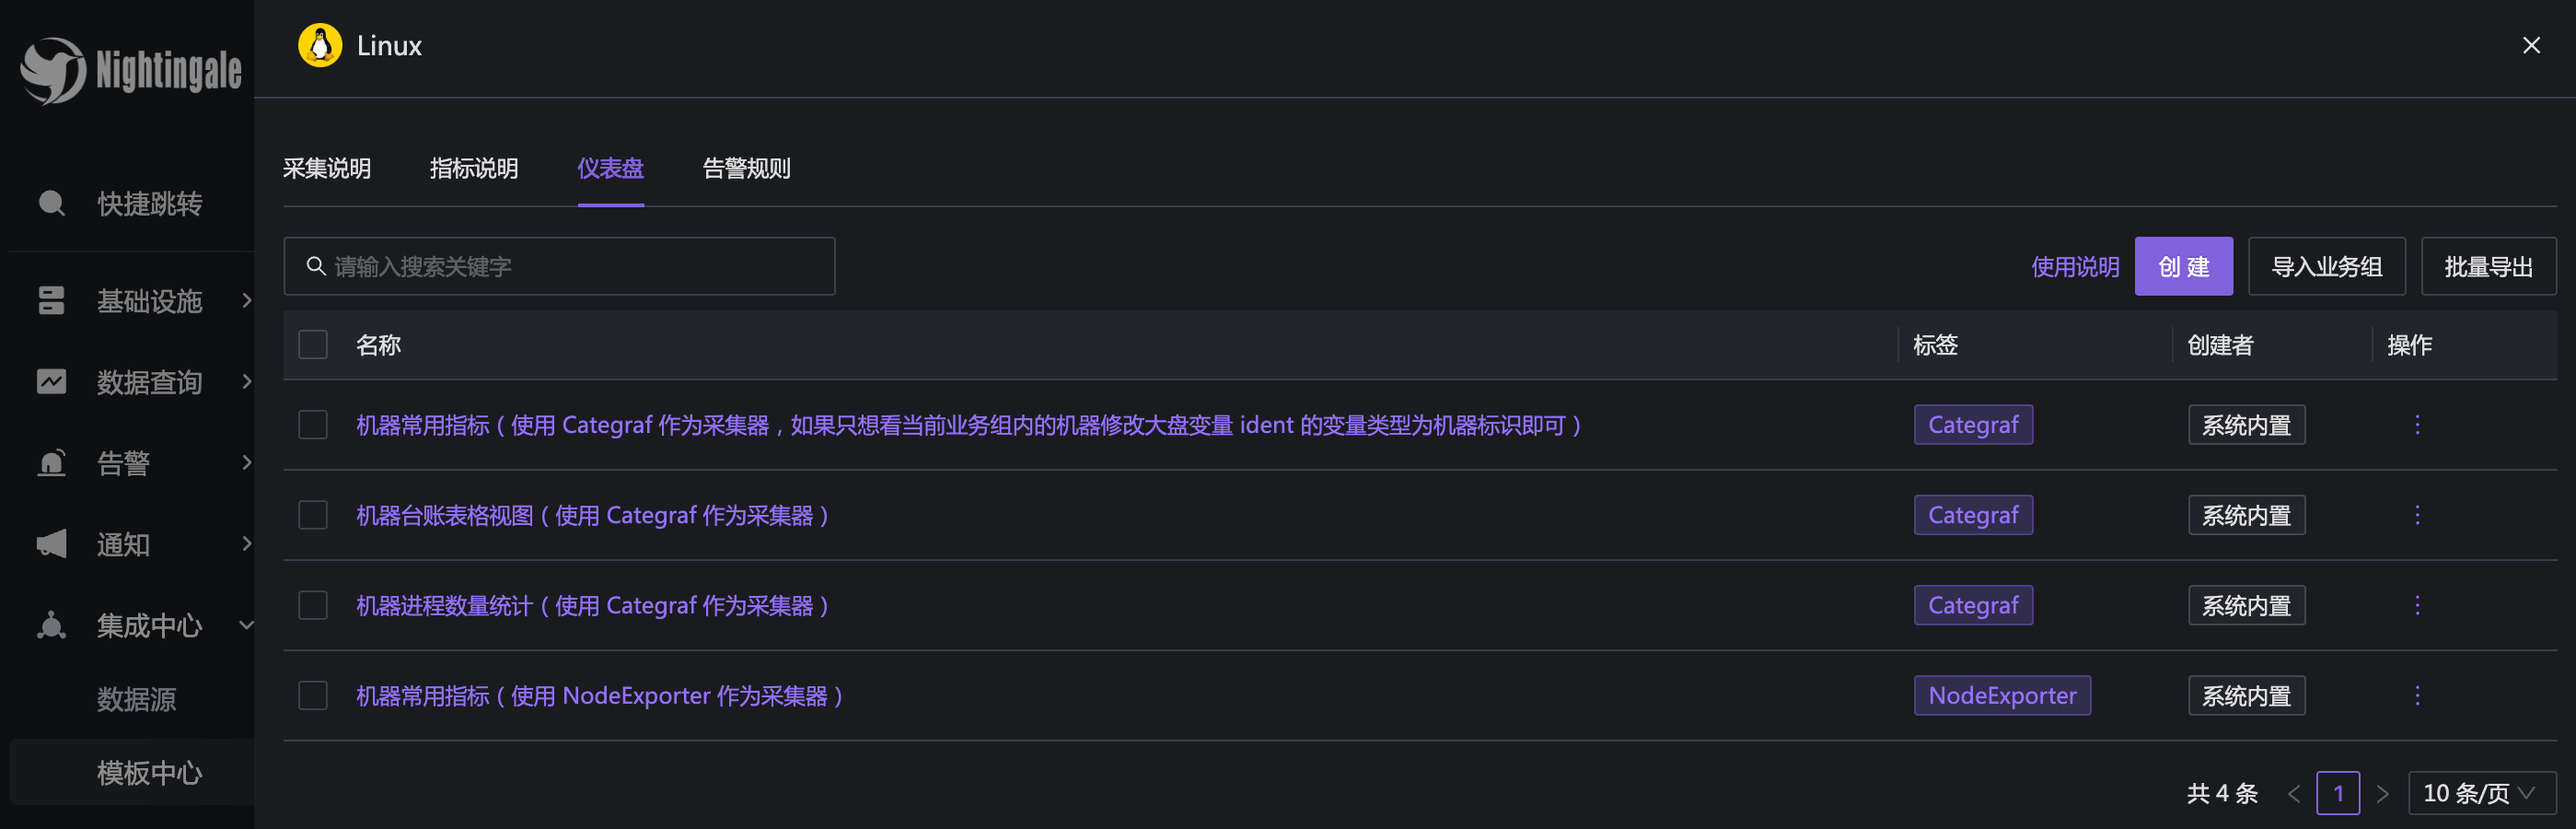
In fact, these dashboards can be found in the Nightingale menu Integration Center - Template Center - Search for Linux:
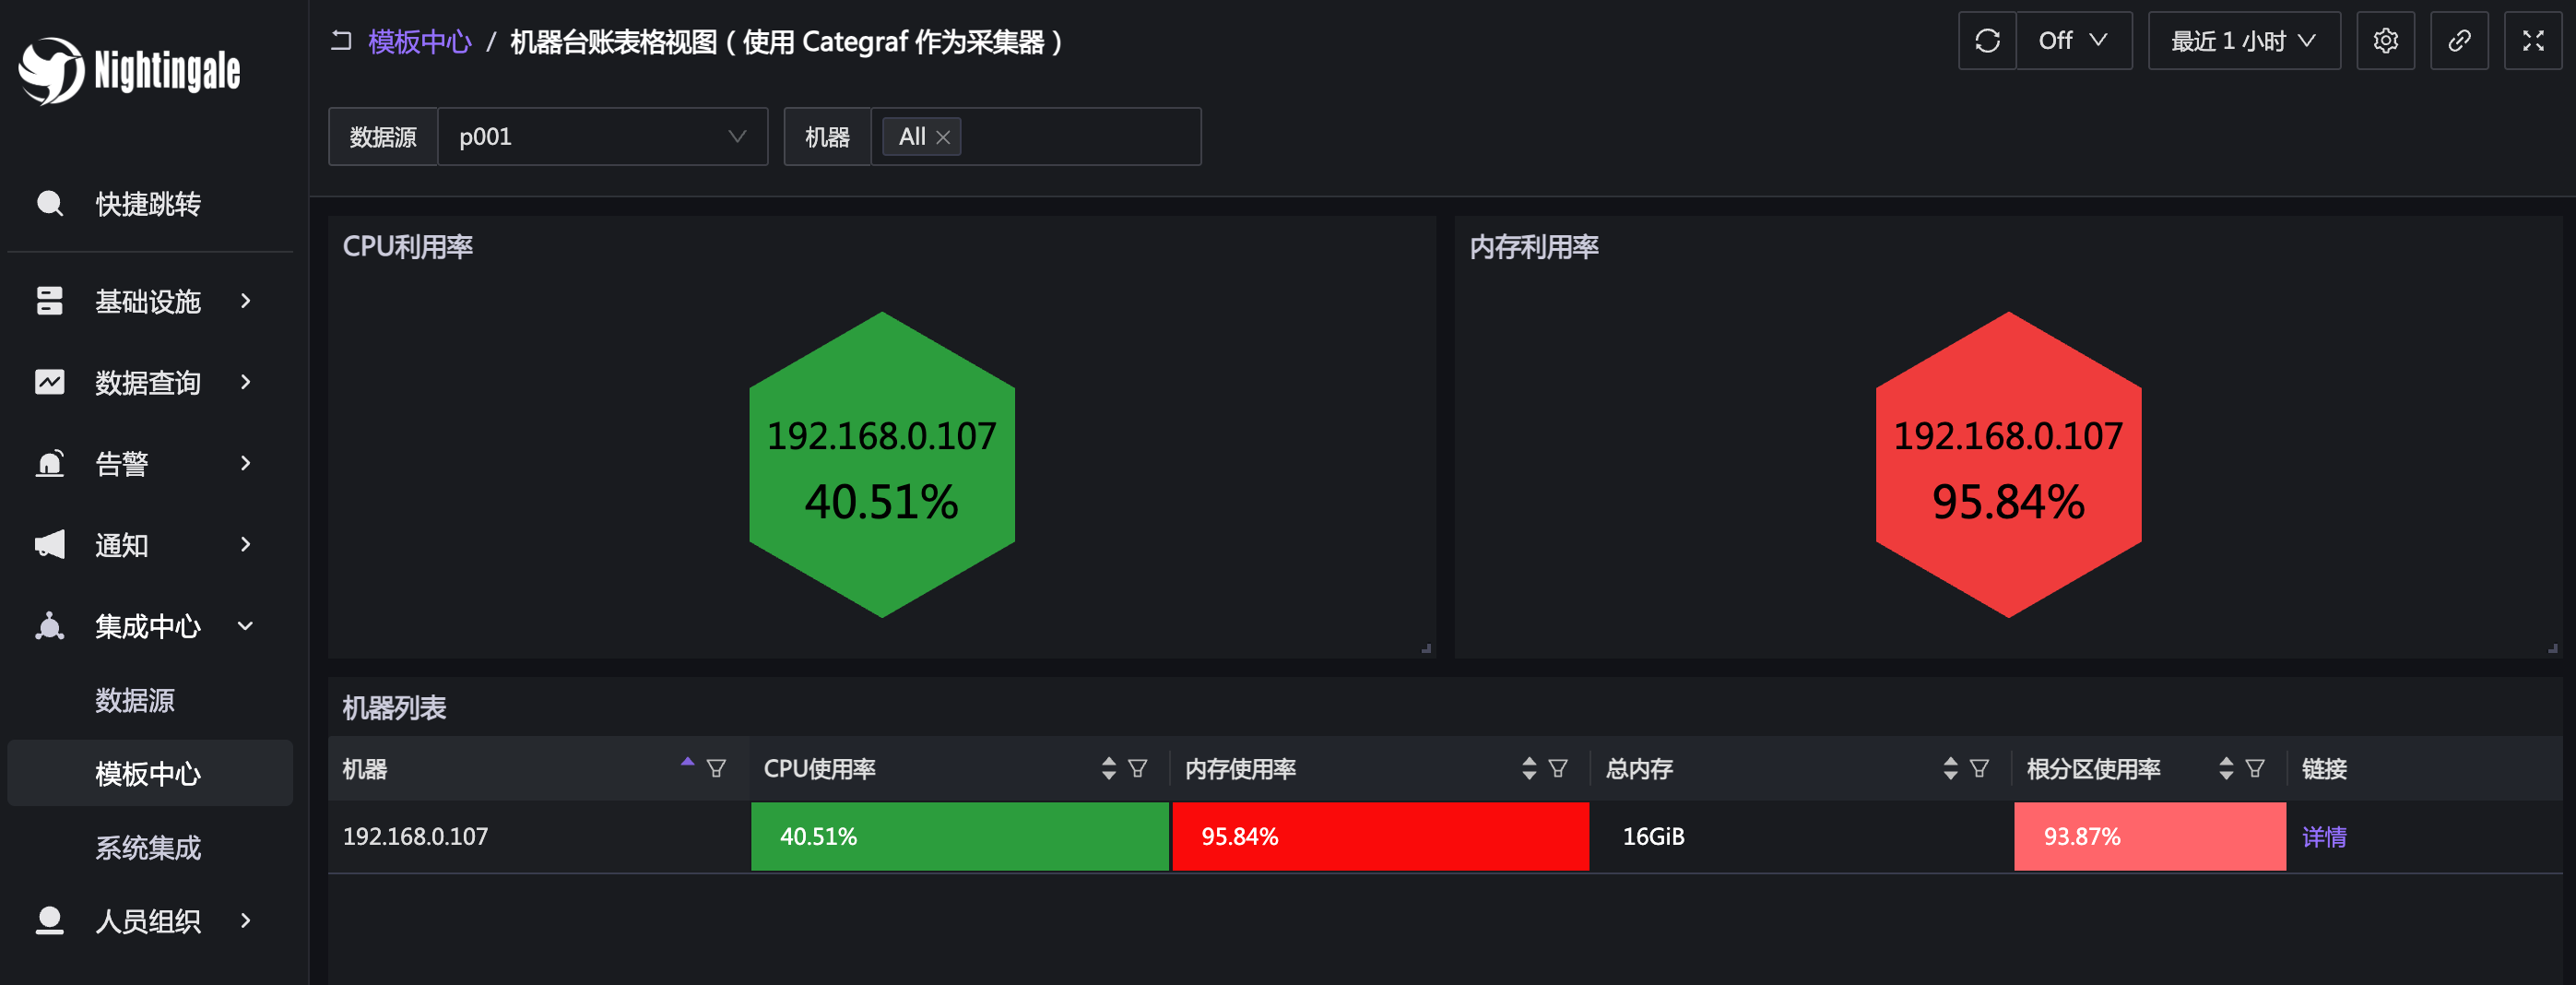
Sample of Categraf overview dashboard:
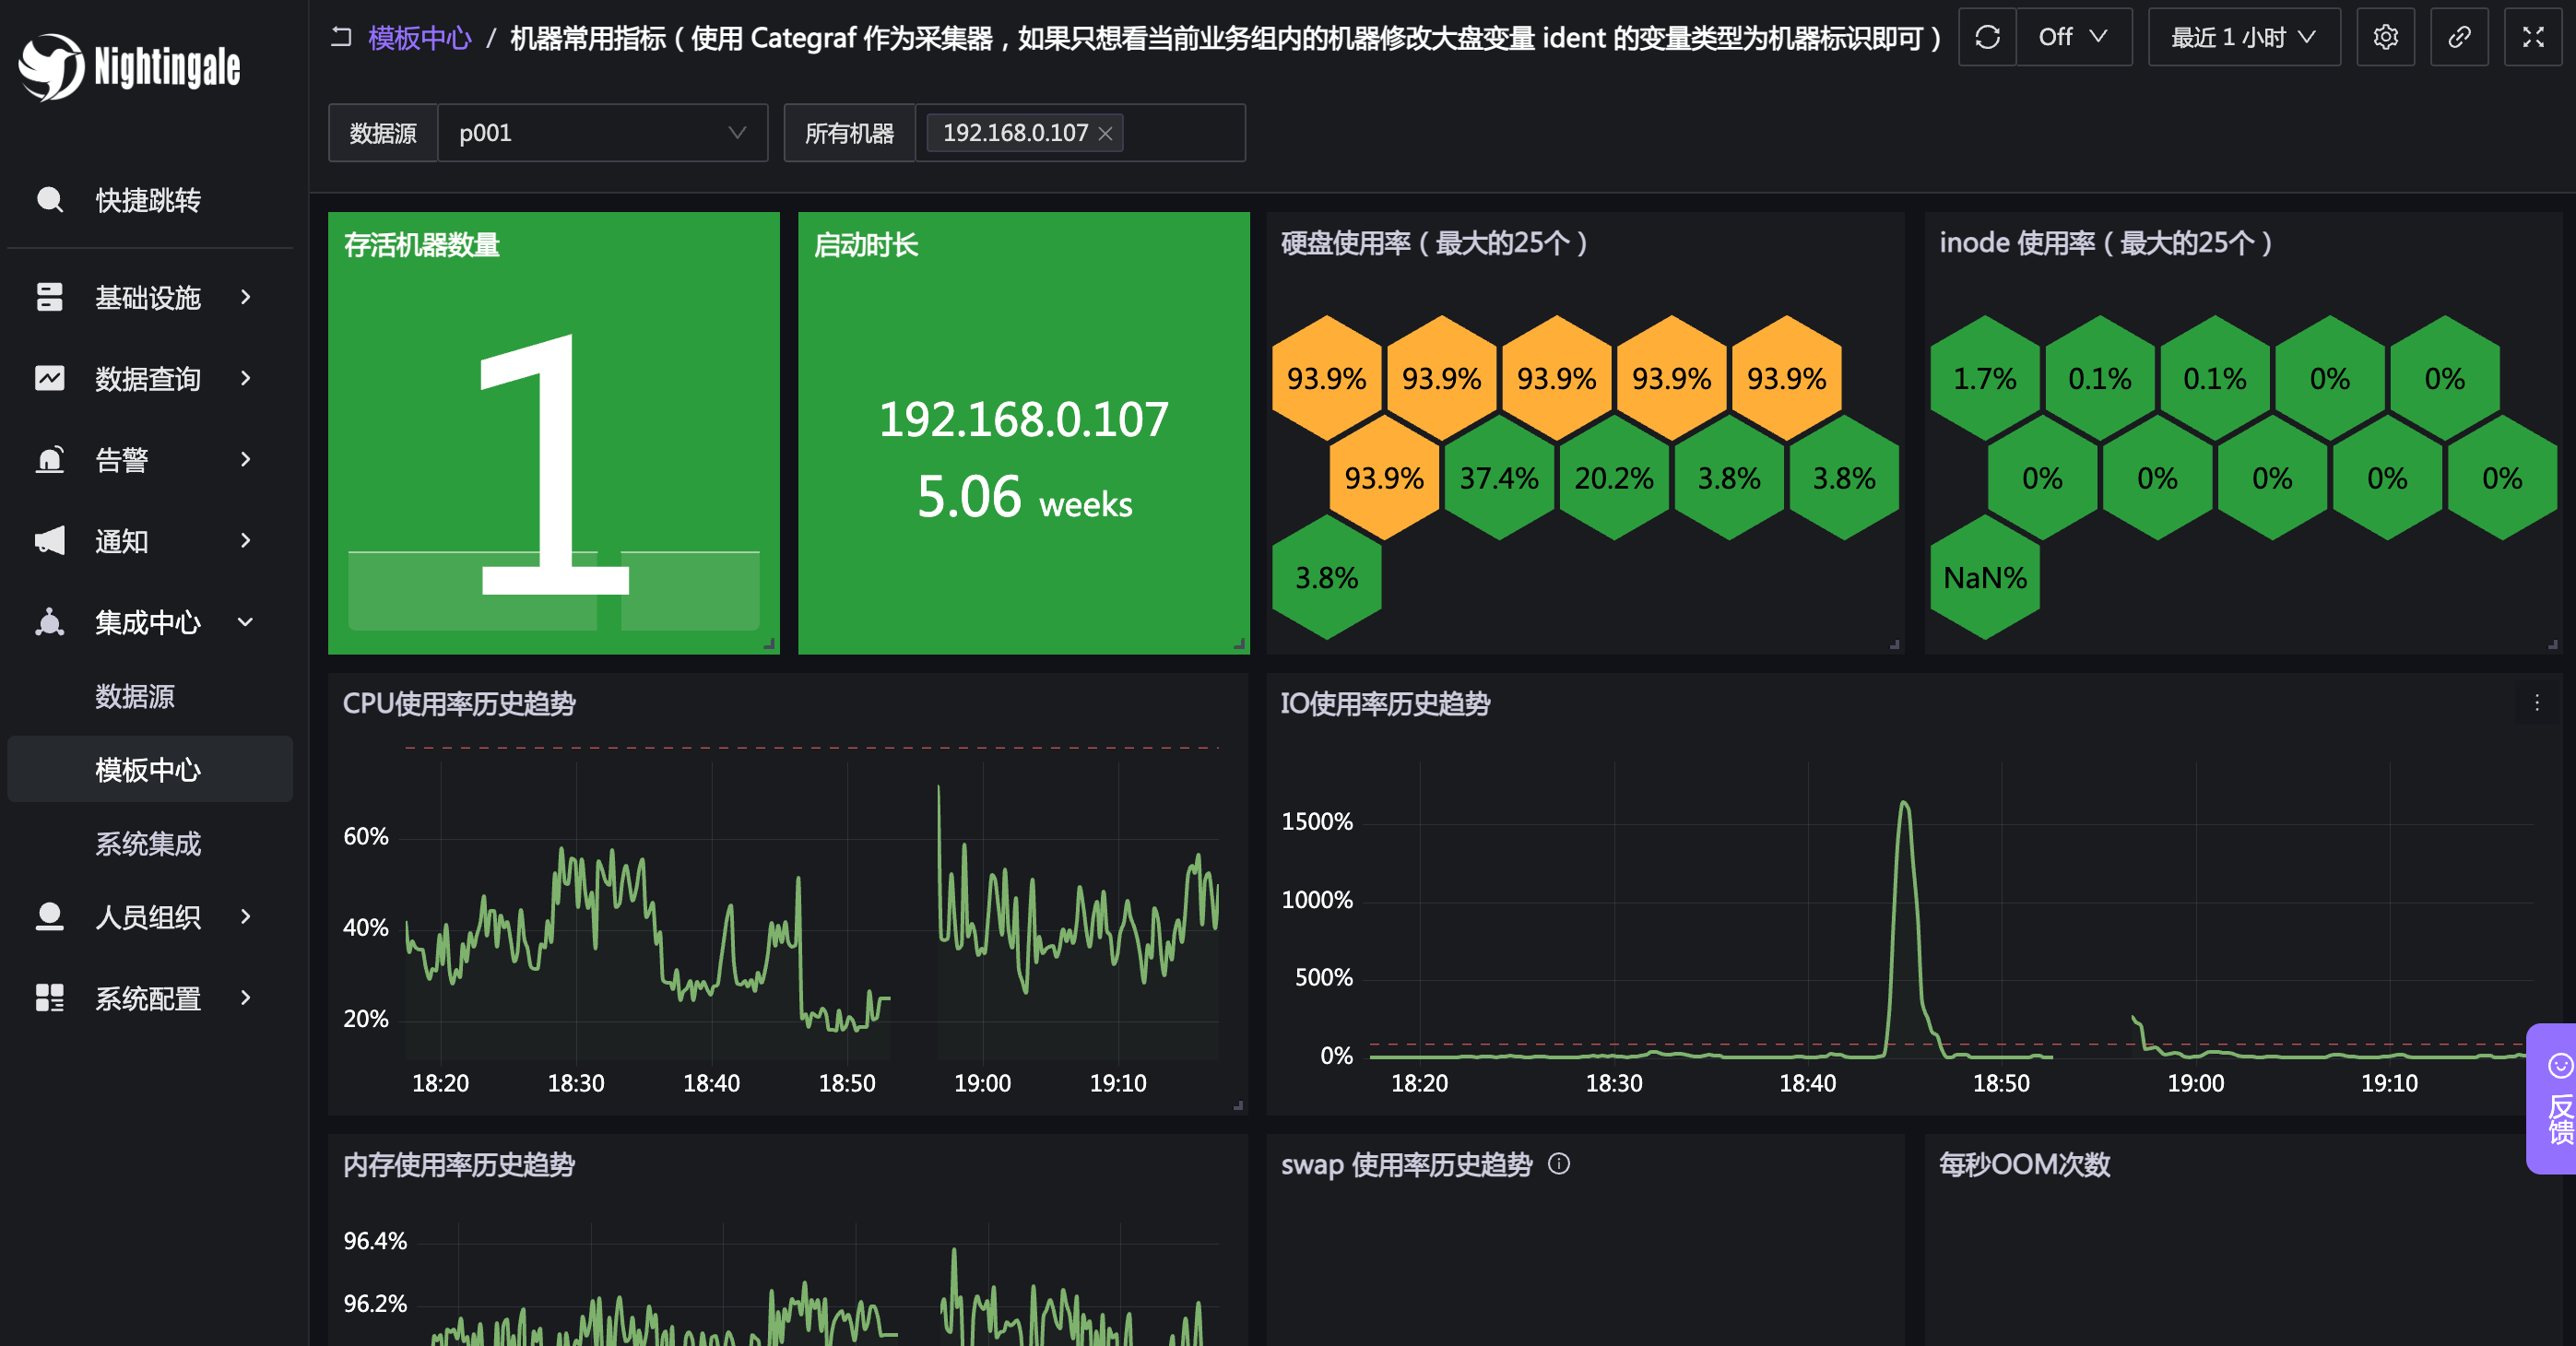
Sample of Categraf machine detailed data dashboard:
The template center already has built-in dashboards for many components, but their quality varies. We will reorganize them one by one when we have time, striving for out-of-the-box usability. However, there are too many components and limited manpower. We welcome community users to participate in organizing and contributing. You can submit your organized dashboards to the dashboards directory under each component in the integrations directory of the Nightingale Github repository via PR.
Integrating Grafana
You can also continue using Grafana for visualization, as each has its own strengths, and using them in combination works better. You can also embed Grafana into Nightingale via iframe through the Nightingale menu Integration Center - System Integration.
There are two embedding methods: one is secure embedding through SSO for user login, and the other is embedding via anonymous access.
Secure Embedding
Please refer to this article: Deep Integration of Nightingale and Grafana with Authentication
Anonymous Embedding
Grafana does not support being embedded by other systems by default. Some configurations need to be modified as follows:
- Enable embedding
Find the allow_embedding configuration item in the Grafana configuration file and set it to true.
- Enable anonymous access
Find the auth.anonymous configuration section, set enabled to true, org_role to Viewer, and configure org_name according to your own environment.
- For HTTPS-enabled Grafana
In the security configuration section, set cookie_secure to true and cookie_samesite to none.
In addition, the configuration methods may vary between different versions of Grafana. If you find any errors in the documentation, you can click “Edit this page on GitHub” below to edit this page directly and submit a PR to modify the documentation.