Log Alerting
Nightingale monitoring supports log alerting, which allows configuring alert rules for log data in data sources such as ElasticSearch, Loki, and ClickHouse. It periodically queries the data sources and triggers alerts when the data in the data sources meets the alert thresholds. The main difference between log alerting and metric alerting lies in the writing of query conditions. Other fields are common, so please be sure to read the content of Metric Alerting first, which will not be repeated here.
ElasticSearch Alerting Principle
ElasticSearch supports different query syntaxes, such as DSL, KQL, Lucene, EQL, SQL, etc. As an alert engine, Nightingale essentially allows users to configure query statements, then periodically queries the data sources, makes threshold judgments on the found data, and triggers alerts when the threshold conditions are met.
The first supported query syntax is Lucene, i.e., the query_string method. After finding the data, a basic statistics is performed, such as counting the number of log lines found, or making statistics on a certain field in the logs to calculate its average, maximum value, quantile, etc. Then the statistical results are compared with the thresholds configured by the user, and an alert is triggered when the threshold conditions are met.
ElasticSearch Alert Configuration
First, configure the data sources, that is, which ElasticSearch data sources the current alert rule will take effect on. This is essentially the same logic as metric alerting.

🟢 Only the data sources configured with the corresponding type will be displayed here in the data source type. That is: if you only configure Prometheus-type data sources, you will not see other types such as ElasticSearch, TDEngine, ClickHouse when creating alert rules.
Then configure the query and statistical conditions:

First, select the index, which supports wildcards. I configured fc* above. Then the most critical part is the filter condition. I configured message.status:>100 above to filter logs where the message.status field is greater than 100. This filter condition uses Lucene syntax, which is different from Kibana’s query syntax. Logs must have a date field, and you need to tell Nightingale which field is the date field through configuration, then configure a time interval. In the above figure, it is configured as 5 minutes, and Nightingale will filter the data of the last 5 minutes according to the date field.
Then there is the statistical analysis method. In the above example, count is selected, which means counting the number of log lines without any Group By conditions.
Finally, there is the threshold judgment, that is, comparing the result of the above count with the threshold, and generating an alert event if the condition is met. In the above example, the threshold is > 0 to trigger an alert, that is, if the result of count is greater than 0, an alert will be triggered.
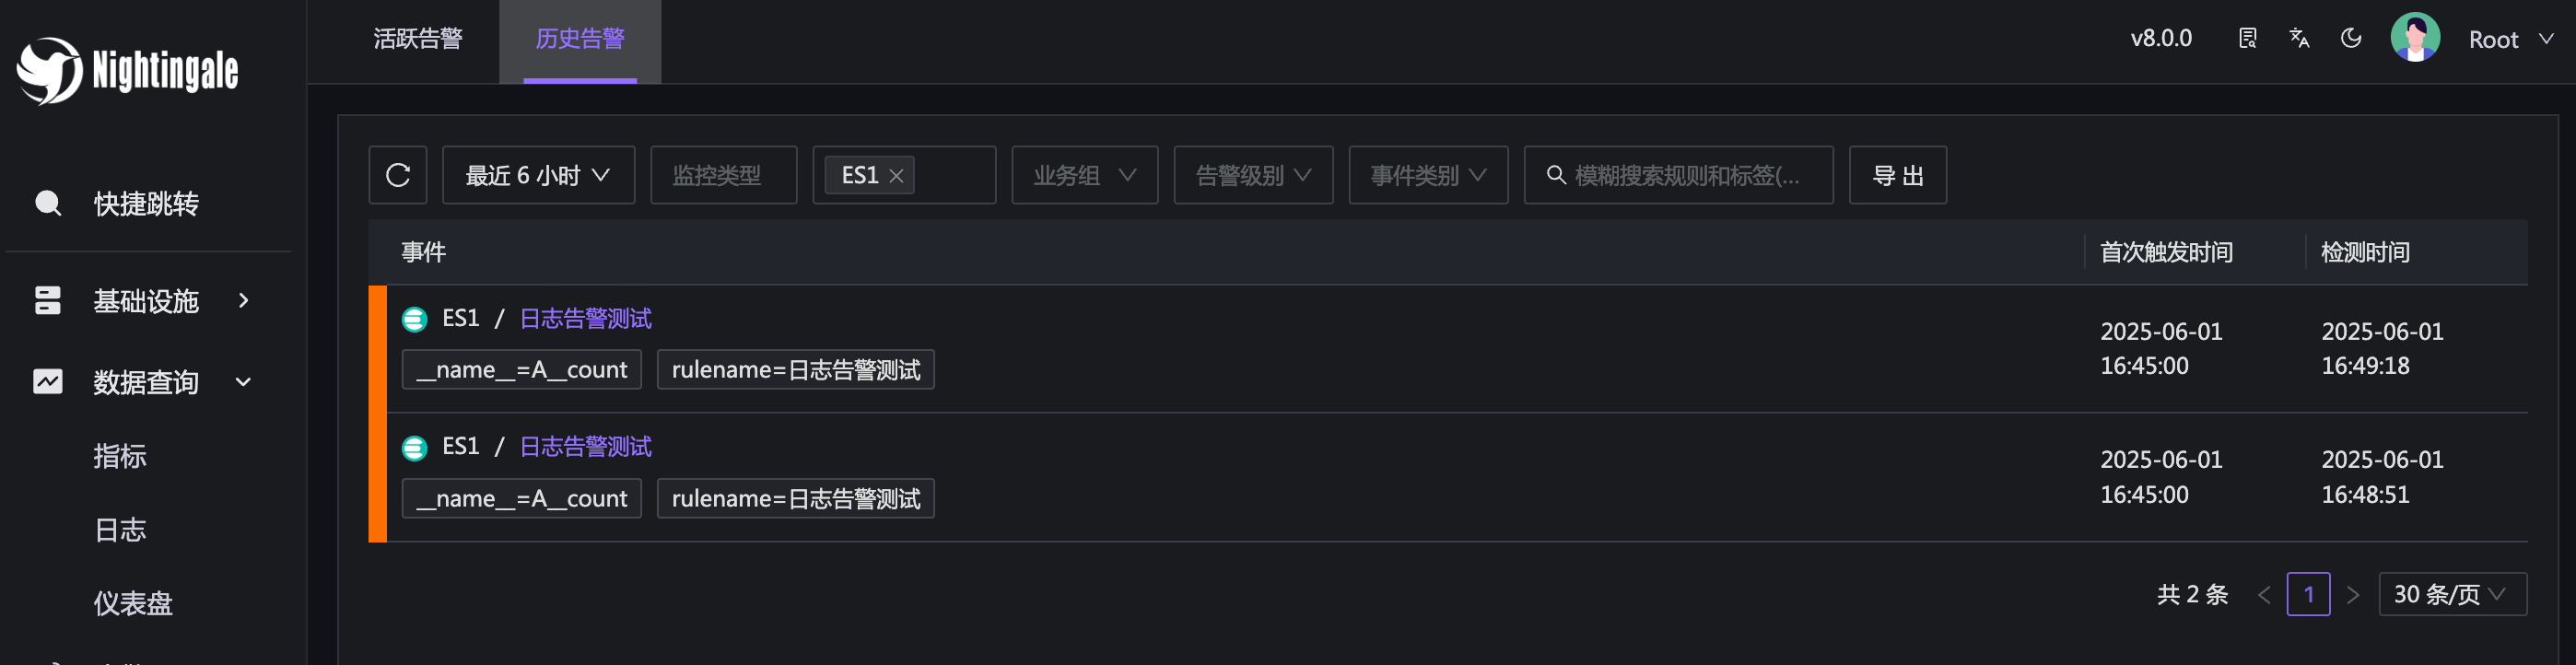
After a short while, we can see the generated alert events:
ElasticSearch Filter Conditions
What other ways can the filter conditions (i.e., message.status:>100 in the above example) be written? You can click the small question mark icon next to the filter condition, and a side panel will display sample explanations of the filter condition writing methods. Some typical writing methods are as follows:
status:activeQuery records where the status field contains “active”title:(quick OR brown)Query records where the title field contains “quick” or “brown”author:"John Smith"Query records where the author field contains the exact phrase “John Smith”count:[1 TO 5]Range query, closed interval, i.e., including 1 and 5date:[2022-01-01 TO 2022-12-31]Date range queryage:>=10Numeric filtering, greater than or equal to 10
Note that to avoid mistakes, it is recommended not to add spaces before or after the colon : following the field. In addition, different conditions can be connected using AND or OR, such as status:active AND age:>=10. For more writing methods, please refer to the official ElasticSearch documentation.