Metric Alerting
Nightingale monitoring divides alerting into two parts: alerting and notification. Alerting refers to the periodic judgment through rules that ultimately generates alert events, while notification refers to the subsequent pipeline and notification process of alert events. This chapter first introduces the alerting part, and we consider it successful when an alert event is finally generated.
Alerting Principles
Nightingale supports two alerting modes: normal mode and advanced mode (the advanced mode is not open-source yet, but it is planned to be open-sourced later):
- Normal mode: The alert threshold is configured in PromQL, with
query conditionsandthreshold settingscombined. If there are no special requirements, normal mode can be used. This mode has the same alerting logic as Prometheus and has good performance. However, it is a bit troublesome to get the value when the alert is recovered. - Advanced mode:
Query conditionsandthreshold settingsare separated. If multiple query conditions need to be calculated by addition, subtraction, multiplication, or division, advanced mode can be used. The on-site values of each query condition will be displayed in the alert event, and the value at the time of recovery can also be easily obtained when the alert is recovered.
Principles of Normal Mode
In normal mode, Nightingale periodically queries the data source according to the execution frequency configured by the user. The query condition is the PromQL configured by the user, and the query method is an instant query, which calls the /api/v1/query interface of the data source. The number of alert events generated is equal to the number of data points retrieved. For example, if the PromQL is cpu_usage_active > 80, Nightingale uses this PromQL to query the time-series database, and the results returned by the time-series database must be data points where the CPU utilization is greater than 80%, which are all data points that trigger the threshold. Therefore, Nightingale should generate alert events.
If the user configures a duration greater than 0 in the alert rule, the process becomes more complex. Nightingale will execute the query multiple times according to the execution frequency within the duration, and generate an alert only if a certain data is found in each query. If the duration is set to 0, it means that an alert will be generated as long as data is found in one query.
If an alert event was generated before, but no data is found in subsequent queries, a recovery event will be generated. After all, if no data is found, it indicates that there is no data in the time-series database that meets the threshold condition, so the time-series database no longer returns any data. For alert recovery, there is an advanced configuration called observation duration, which means that after a recovery event is generated, Nightingale will continue to observe for a period of time. If data is found again within the observation duration, no recovery event will be generated (the alert state will continue to be maintained); if no data is found in each query within the observation duration, the recovery event will be finally generated.
From the above analysis, when the alert is recovered, the time-series database does not return any data, so Nightingale cannot get the value at the time of recovery, which is a pain point for many users when using normal mode. Nightingale has designed a way to solve this problem. For details, please refer to the article “How to get the value when the alert is recovered?”.
Principles of Advanced Mode
In advanced mode, the threshold condition is not put into PromQL. Only filter conditions are written in PromQL. For example, the PromQL:
cpu_usage_active{cpu="cpu-total"}
In this way, Nightingale uses this PromQL to query the time-series database, and the time-series database returns all data points of CPU utilization each time (with slightly poor performance). Then Nightingale judges the returned data in memory according to the threshold judgment rules configured by the user, as shown in the following figure:

The key difference between advanced mode and normal mode is whether the threshold judgment is done in PromQL and thus by the time-series database, or in Nightingale’s memory. In advanced mode, if a recovery event is triggered, the TriggerValue in the recovery event will be automatically filled with the value at the time of recovery. Compared with normal mode, it is easier to obtain the value at the time of recovery.
In advanced mode, there will also be a data missing judgment logic, commonly known as NoData alert. Nightingale’s behavior is: periodically query the data source, store the found data in memory, and if data is found again in the next query, everything is fine. If a certain piece of data is not found in the next query, an alert will be triggered for that data.
Function Description
After understanding the principles, let’s configure an alert rule to demonstrate how to use Nightingale’s metric alerting function.
Creation Entry
The menu entry is in Alerts - Rule Management - Alert Rules, as shown in the following figure:
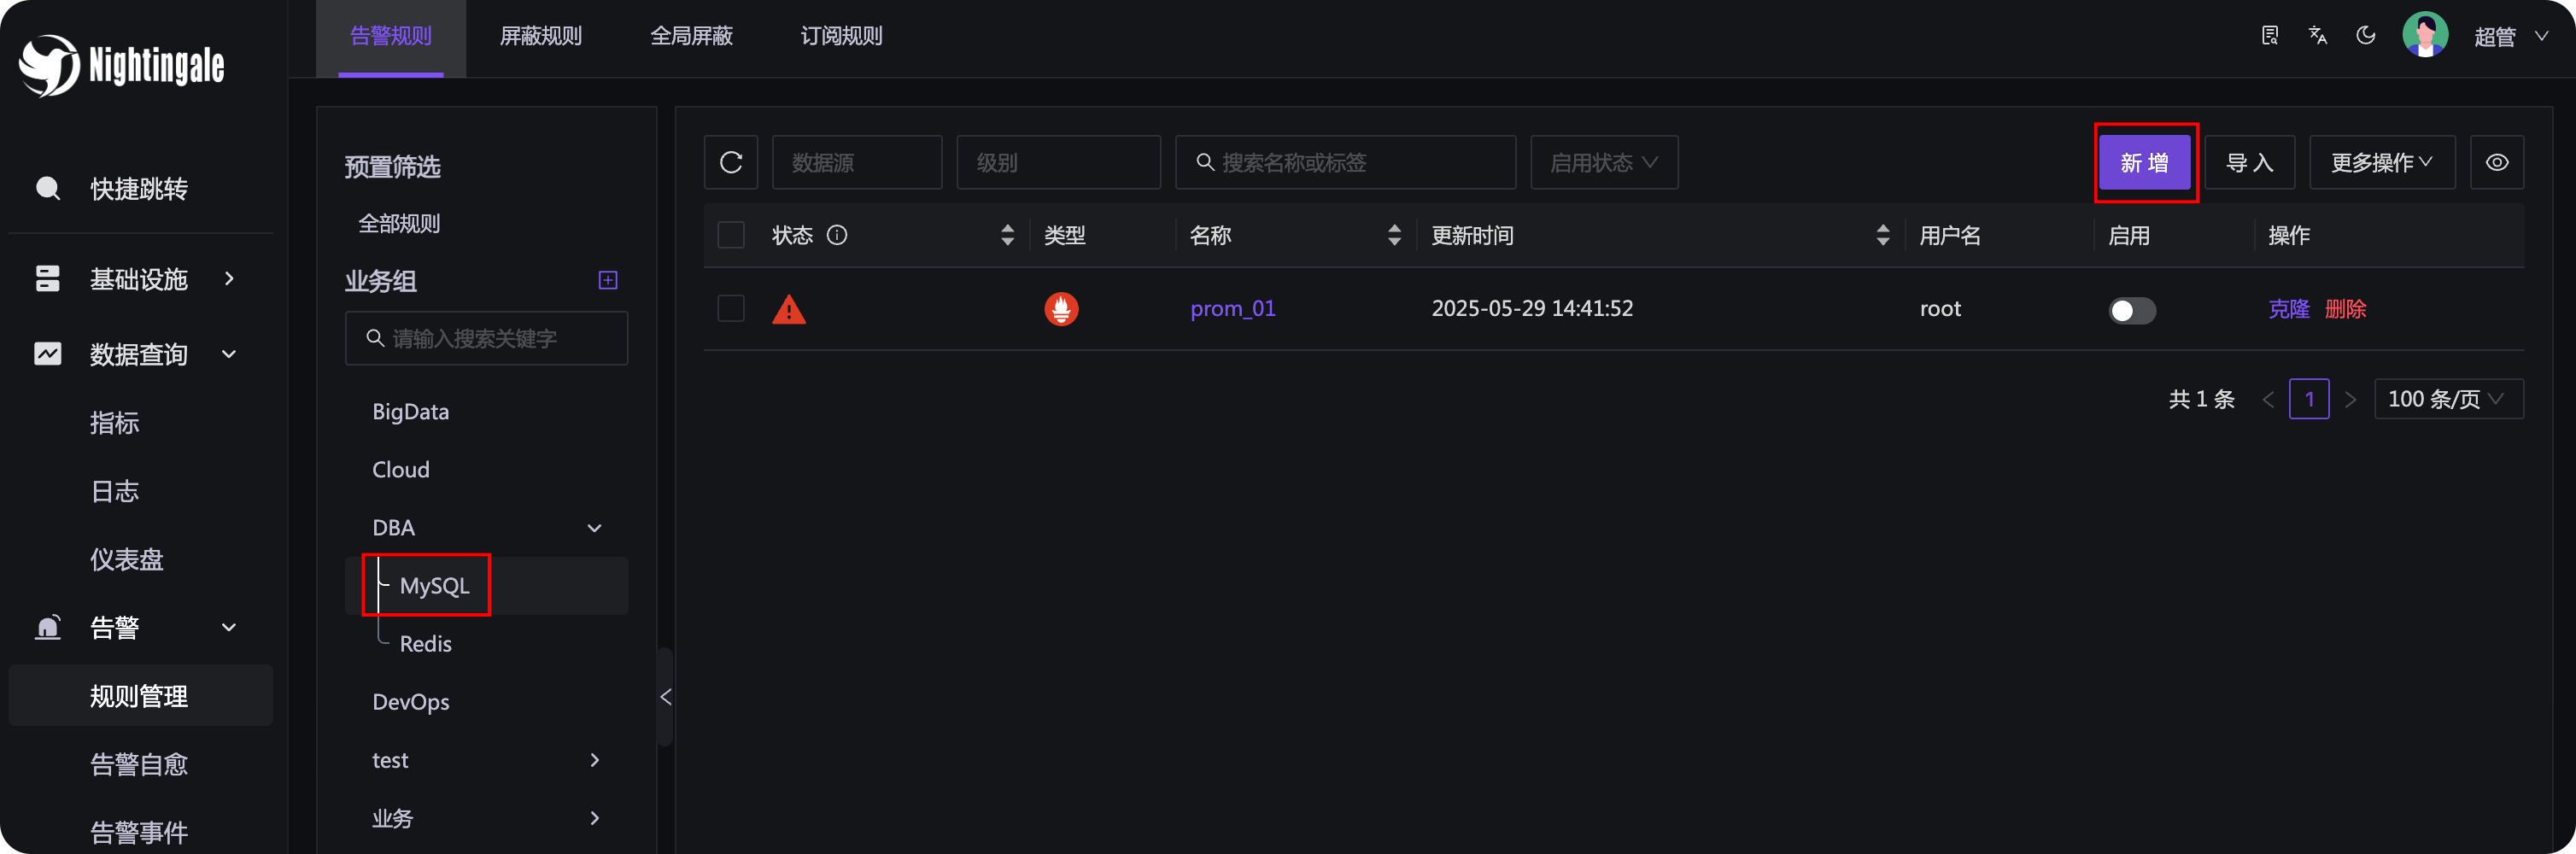
First, select the business group on the left. If there is no business group, you need to create one first. Because there may be many alert rules, they need to be managed by category and subject to permission control, so alert rules are bound to business groups.
Business groups are a flat list, but can be rendered into a tree structure. As long as the
/symbol is used in the business group name, it can be rendered into a tree structure. For example,DBA/MySQLandDBA/Rediswill be rendered into the tree style as shown in the above figure. Of course, it is necessary to set the business group display mode to tree and set the business group separator to/in theSystem Configuration - Site Configurationmenu.
Next, we will focus on explaining the meaning of each configuration item of the alert rule.
🟢 Tip: On the rule configuration page, there are tooltips next to each form (small question mark icons, you can see usage prompts when you mouse over them). Please remember to check them.
Basic Configuration
- Rule Name: The name of the alert rule, such as “High machine load”. Variables can be referenced in the rule name, such as
{{ $labels.instance }}, but this is highly not recommended, because it will lead to different names of the finally generated alert events, which is very inconvenient when you want to aggregate and view alert events. - Additional Labels: The additional labels configured here will be appended to the labels of the generated alert events, which can be used for aggregation and filtering of alert events later.
- Remarks: A more detailed description of the alert rule, which supports configuring variables such as
$labelsand$value.
Rule Configuration
- Data Source: Select the data source type and filter conditions to specify which data sources the current alert rule takes effect on. Because many companies have multiple sets of Prometheus, this can facilitate rule management.
- Alert Condition: Configure PromQL. You can perform some condition filtering and four arithmetic operations in PromQL. For example, this PromQL:
http_api_request_success{region="beijing"} / http_api_request_total{region="beijing"} < 0.995means: calculate the success rate of all HTTP requests in thebeijingregion. If the success rate is less than99.5%, an alert will be triggered. If the alert engine finds data through this PromQL, it indicates that there are abnormal points. If the abnormality persists in multiple queries and finally meets the duration, an alert event will be generated. - Multiple Alert Conditions and Level Suppression: In an alert rule, multiple PromQL query conditions can be added. At this time, a
level suppressionfunction switch will automatically appear. If the level suppression switch is turned on, if two conditions generate alerts at the same time, only the high-level alert will be sent, and the low-level alert will be suppressed to reduce interference. - Execution Frequency and Duration: Both configurations provide tooltips on the page, and you can see usage prompts when you mouse over them. The execution frequency is equivalent to
evaluation_intervalin Prometheus, and the duration is equivalent toforin Prometheus. If the duration is 0, it means that an alert event will be generated as long as data is found in one query.
Event Relabel
The page provides documentation for this part, please refer to it yourself. There is a relabel mechanism in Prometheus, which many people are familiar with (if you haven’t learned about it before, you can Google it, it’s a very useful design). Prometheus performs relabeling on time-series data, while Nightingale performs relabeling on generated alert events.
For example, if there is a label instance=10.1.2.3:9090, you can extract the IP information through relabel to generate a new label ident=10.1.2.3. Nightingale’s alert self-healing function needs to extract machine information from alert events, which is actually the value of the ident label. Extracting machine information through relabel and writing it into the ident label facilitates subsequent alert self-healing (provided that you configure hostname="$ip" in Categraf).
Effective Configuration
This part also provides usage instructions on the page, please refer to it yourself. The most important configuration here is the effective time period. For example, an alert rule can only take effect during the day, and another alert rule can only take effect at night, which can be configured through the effective time period.
Notification Configuration

In the old version, alert recipients and notification media were directly configured in the alert rules, which was cumbersome to modify in batches. The new version extracts the notification logic and abstracts it into notification rules to handle all logic after an alert event is generated. The notification rules will be introduced in detail later.
Each other field in the notification configuration has a tooltip, and you can see usage prompts when you mouse over them, so they will not be repeated here.
Alert self-healing: After an alert is generated, automatically execute a specific script on the alerted machine (or a specified central control machine). Where does the information of the alerted machine come from? It is taken from the ident label of the alert event. Which self-healing script to execute specifically? It is specified through the Alert Self-healing field under the notification configuration.
Additional information is similar to Annotations in Prometheus alert rules. After an alert event is generated, Nightingale will append this additional information to the alert event, which can be referenced in the message template later and finally displayed in notifications such as DingTalk, Feishu, email, etc.
Practical Demonstration
In order to generate an alert event as soon as possible, I configured a PromQL that will definitely trigger:
cpu_usage_active > 0
🟢 The indicator
cpu_usage_activeis collected by Categraf, which represents CPU utilization. Obviously, CPU utilization will definitely be greater than 0, so this rule can trigger an alert event soon. If you are not using Categraf, you will not have this indicator. Please use the indicators in your own time-series database for testing.
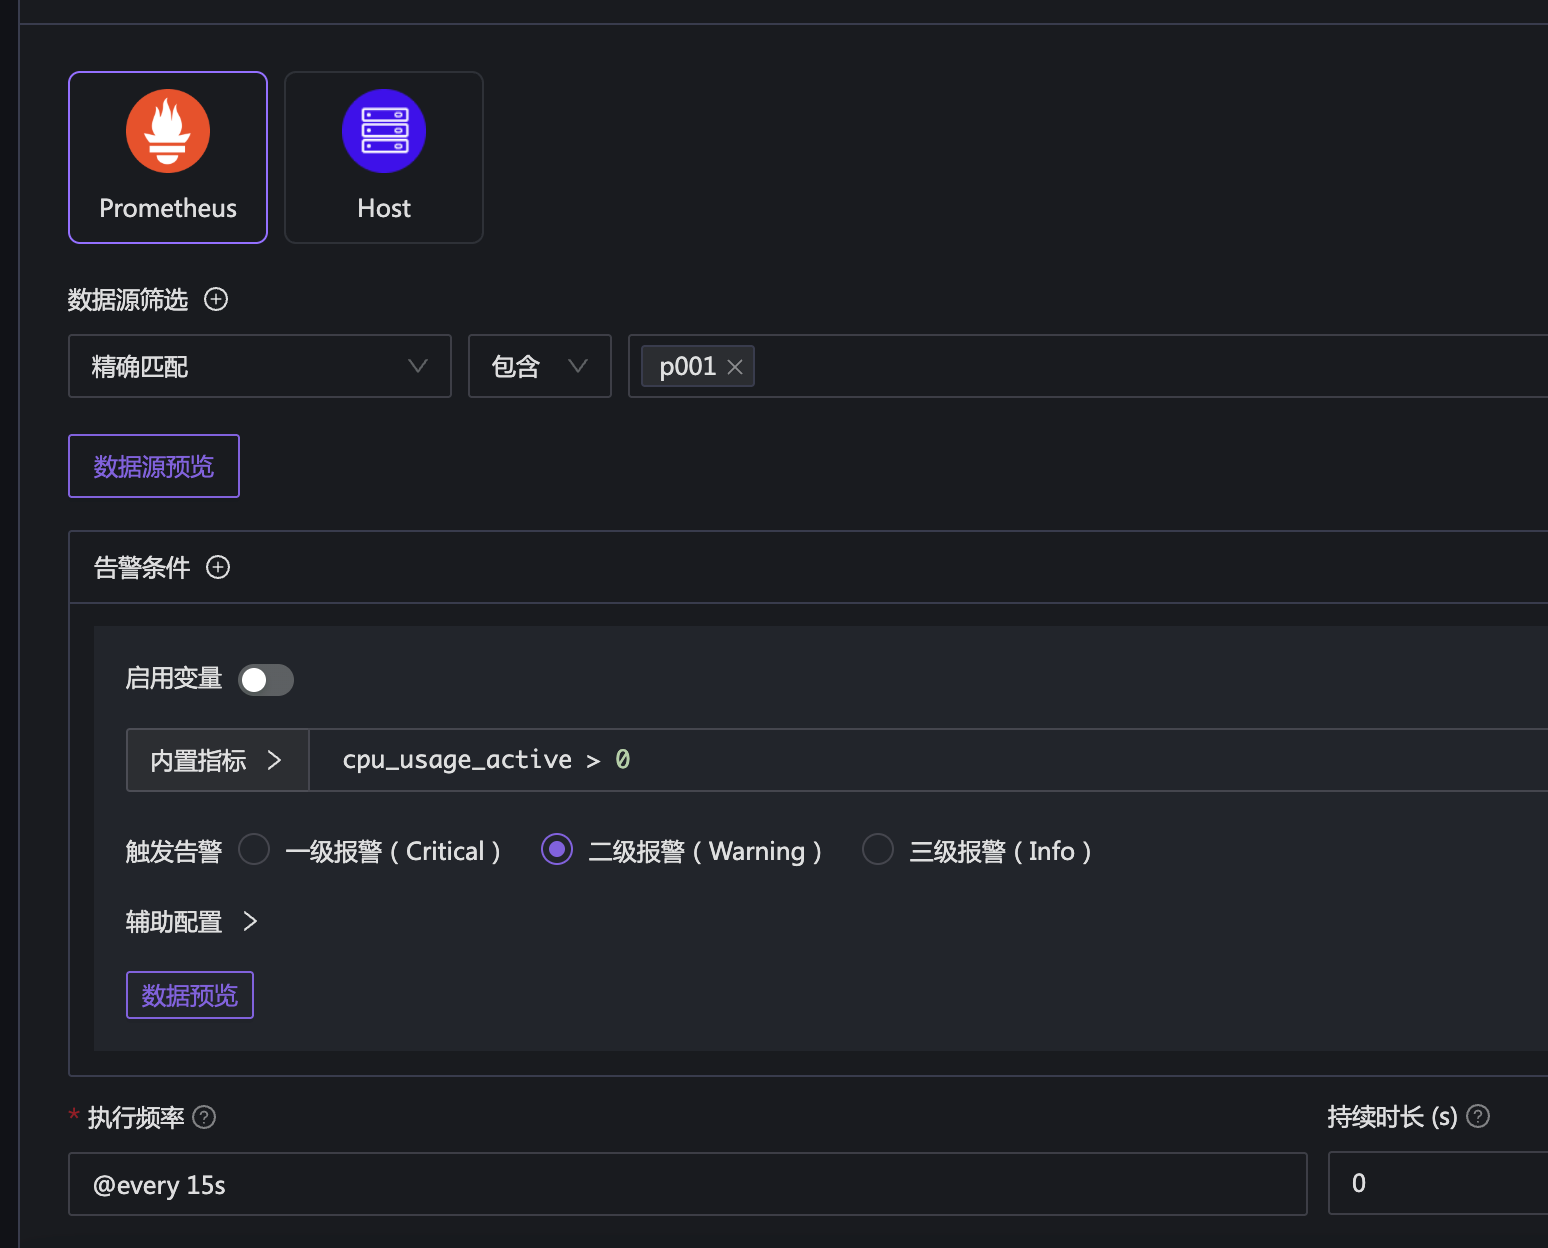
In the above example, to speed up the generation of alert events, I set the execution frequency to 15s and the duration to 0. In this way, Nightingale will query the data source every 15s, and generate an alert event if data is found.
After a while, you can find that the status field on the left side of the alert rule becomes a red exclamation mark, indicating that an alert event has been triggered. Clicking on it will show the relevant alert events generated by this rule in the side panel. Of course, you can also see the current active alerts (unrecovered alerts are called active alerts) and all historical alerts in the alert events menu.

The first alert event above is the one just tested, and the other events are from previous tests, so you don’t need to care about them. The alert event is generated, indicating that the alert rule is configured correctly. Next, configure the notification rule to specify who will receive what kind of alert events and through which notification media (phone calls, SMS, emails, Feishu, DingTalk, WeChat Work, etc., called notification media).