Quick Start(Starting from agent)
Configure Pushgw.Writers
Configure Pushgw.Writers in config.toml. The default configuration is as follows:
[[Pushgw.Writers]]
# Url = "http://127.0.0.1:8480/insert/0/prometheus/api/v1/write"
Url = "http://127.0.0.1:9090/api/v1/write"
...
Make sure that the Url is prometheus remote write api address.
Install agent
We recommand you to use Categraf as agent collector. Categraf can receive monitoring data as well as heartbeat requests.
Then start Categraf and you’re done.
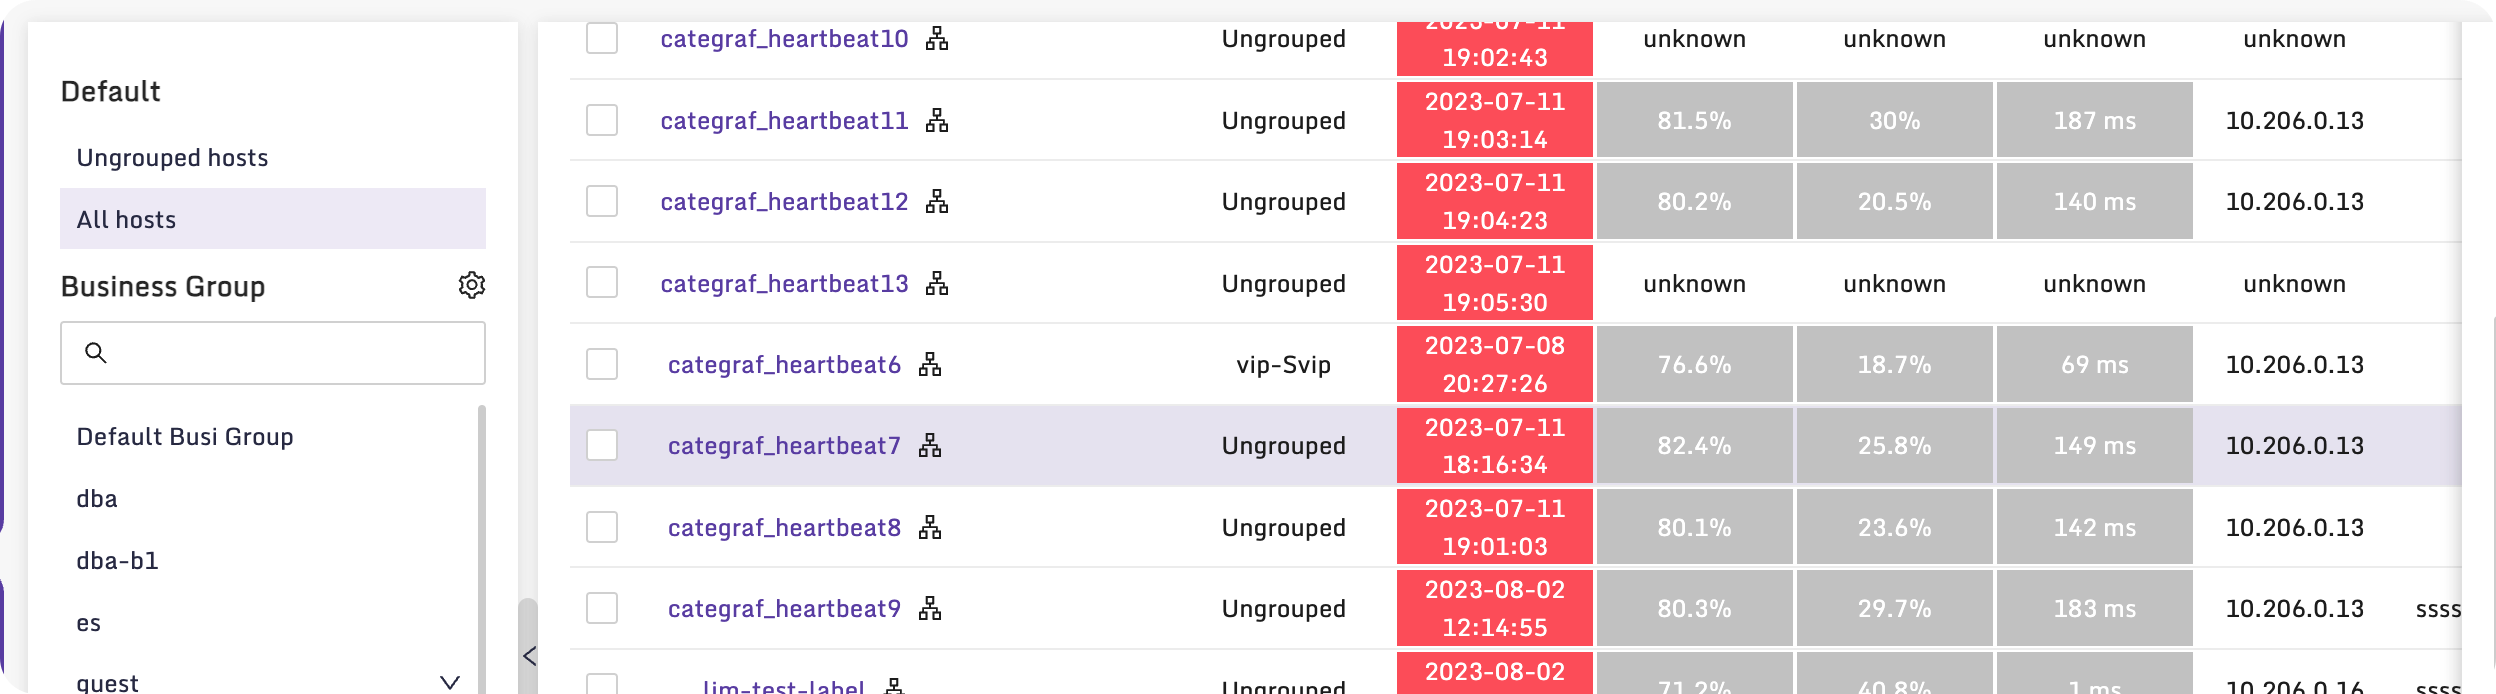
Check Host List
Menu location: Infrastructure -> Host. You’ll see the host list under All hosts.
Check Host Metrics
Menu location: Metrics -> Explorer. You can use cpu_usage_active as promql query to check host metrics.
Import dashboards
Menu location: Dashboard -> Built-in. You can clone Linux Host by Categraf under Linux Category to Default busi group then view the data through the dashboard.
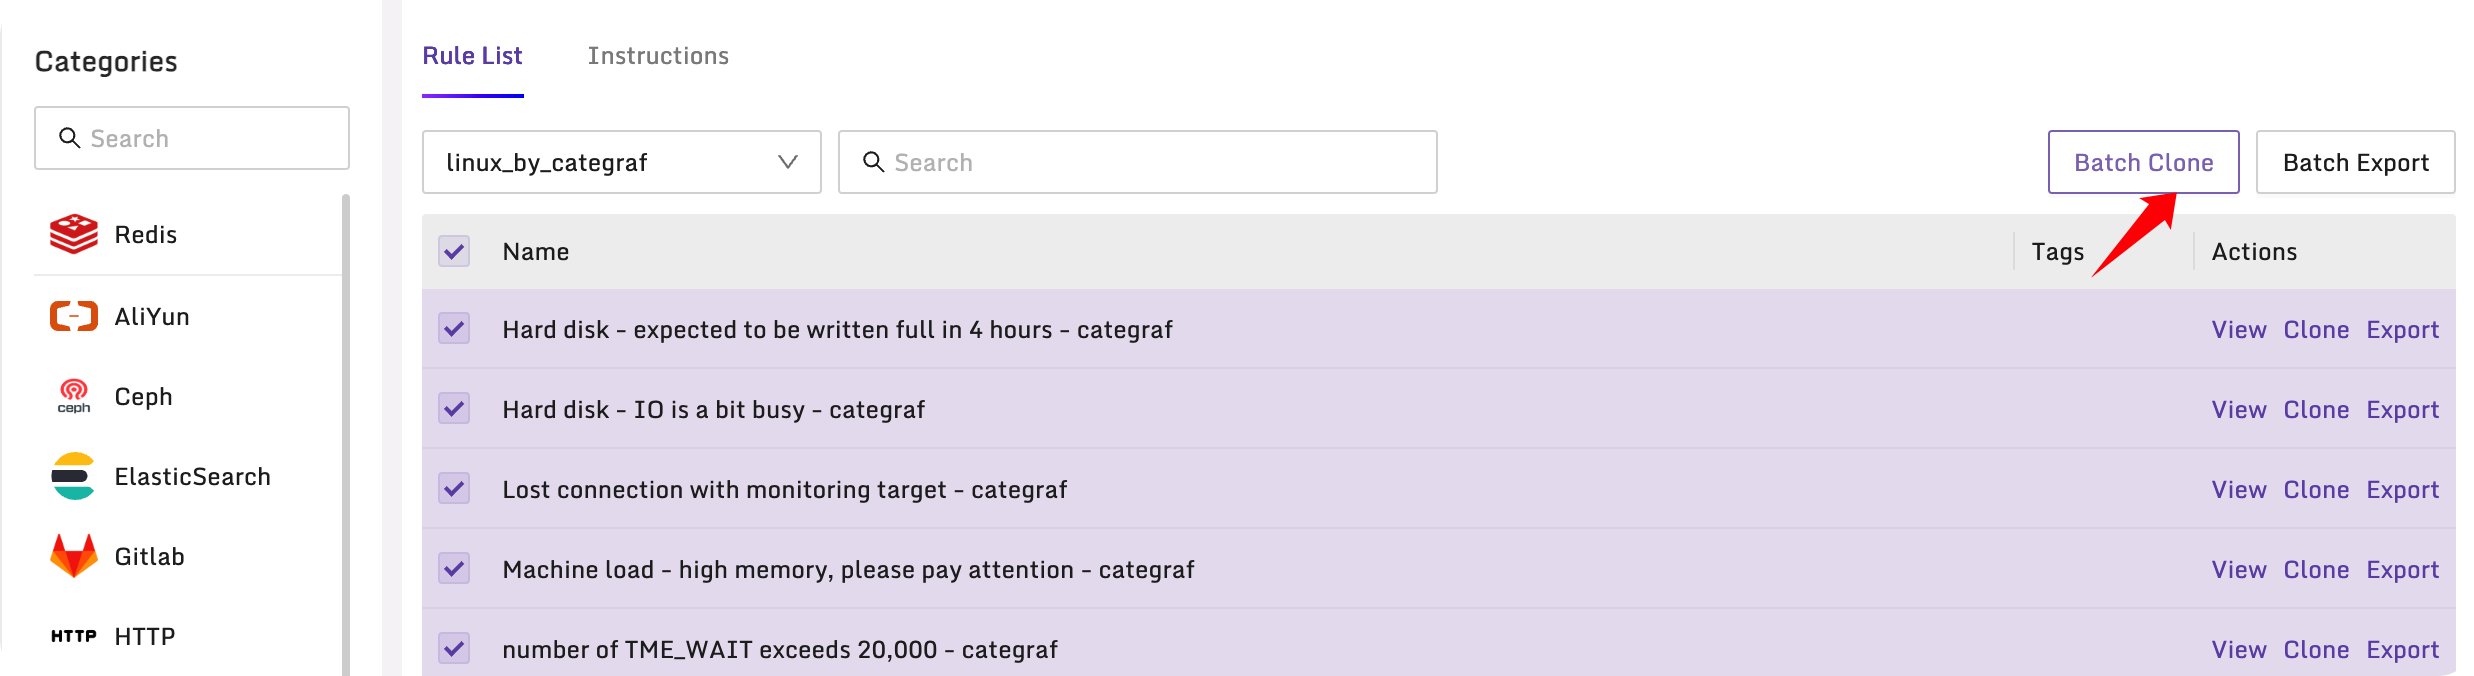
Import alerting rules
Menu location: Monitors -> Built-in. You can clone all the rules under Linux Category to Default busi group then alarm will be triggered if any rule is violated.
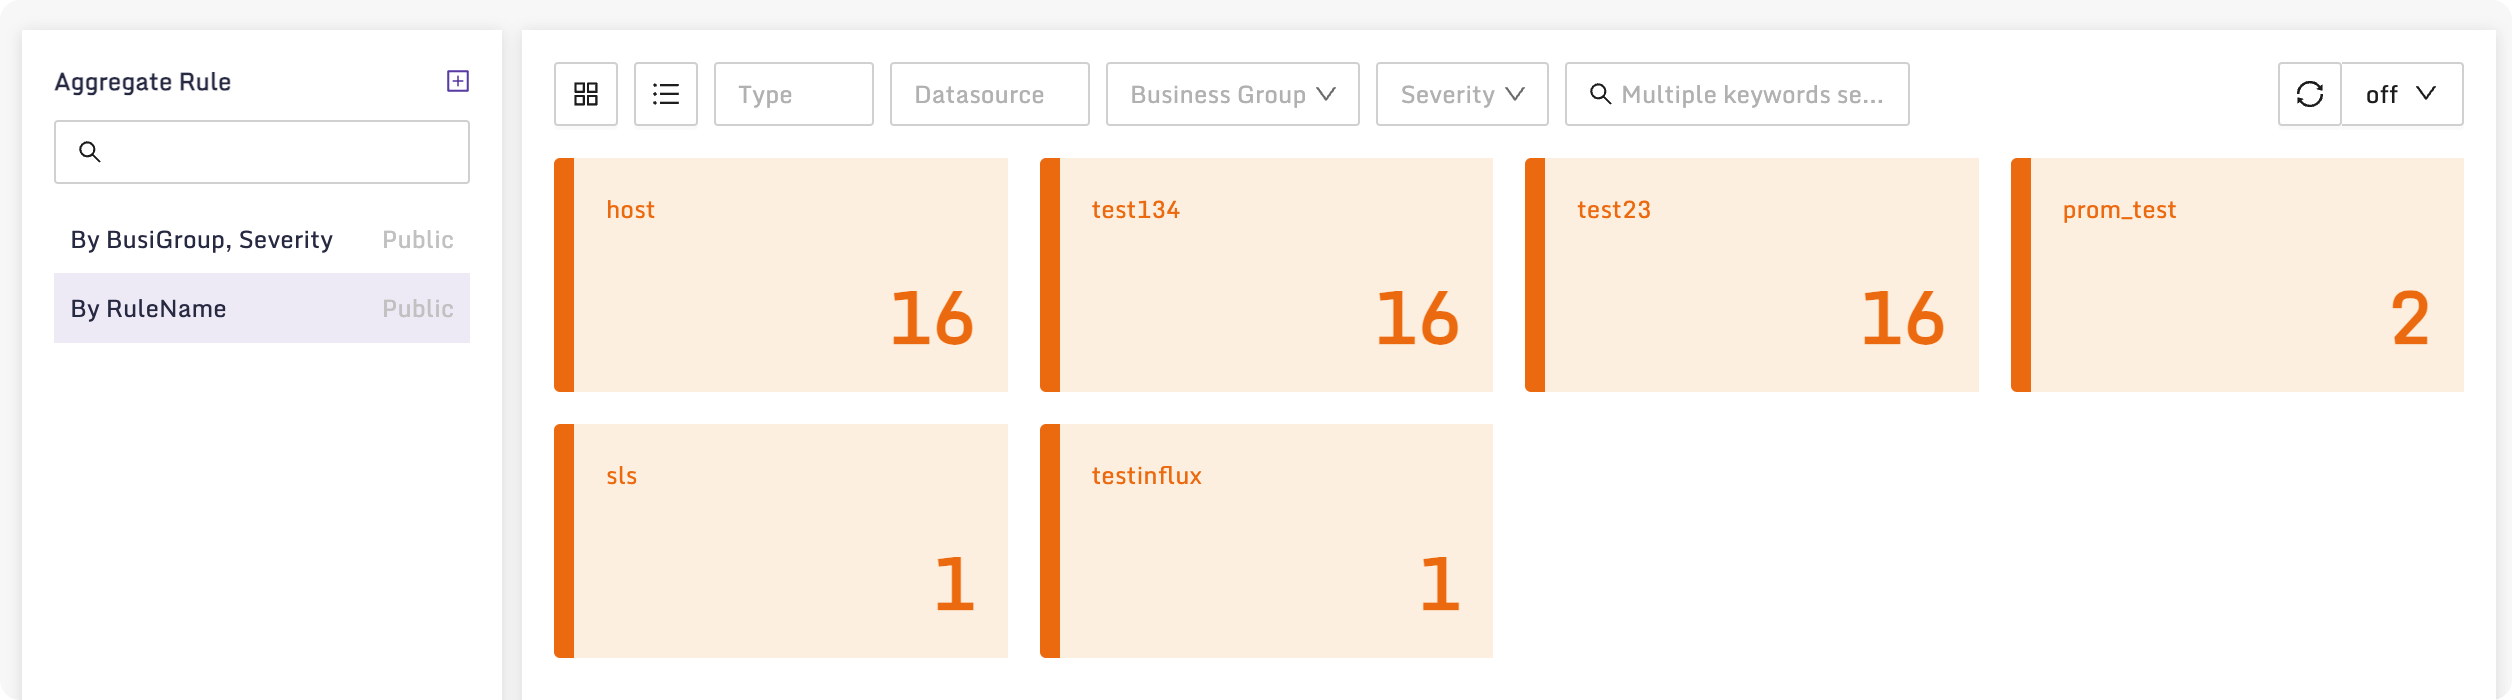
Screenshot of the Active alarms page: