Alerting Principles and Process Explanation
The key feature of Nightingale monitoring is its alerting engine. To achieve flexibility, the entire alerting process involves multiple functional points. This article introduces relevant knowledge from the perspective of principles and data flow, which will be helpful for you to use Nightingale and troubleshoot alerting issues.
Overview of Data Flow Principles

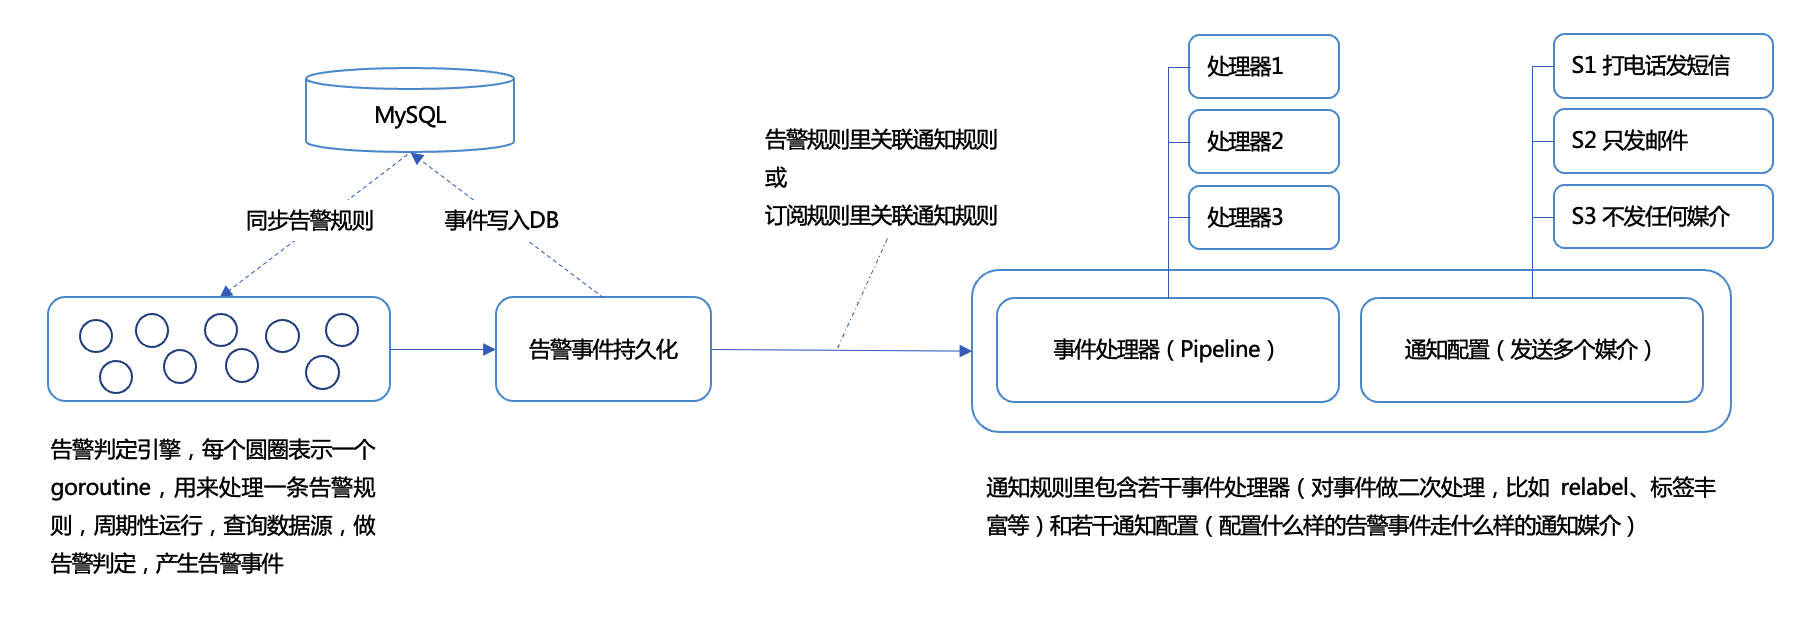
- Users configure alert rules in the Web UI, and the rules are stored in the DB (usually MySQL).
- The alerting engine (the
n9eprocess has a built-in alerting engine, and then9e-edgeprocess in edge mode also has a built-in alerting engine) synchronizes alert rules from the DB to memory (usuallyn9e-edgecannot read the DB directly, but obtains alert rules by calling the interface of the centraln9e). - The alerting engine creates a goroutine (coroutine, which can be roughly understood as a lightweight thread) for each alert rule, periodically queries the storage according to the frequency configured in the alert rule, judges data anomalies, and finally generates alert events.
- After an alert event is generated, it is first persisted to the DB (usually MySQL), and then proceeds to the subsequent notification rules.
- Notification rules include two parts: several event processors (such as relabel, event update, event drop, ai summary, etc.), and several alert notification configurations (for example, Critical alert events are associated with phone calls and SMS notification media, while Warning alert events are only associated with email media).
Alert Rules
The core of an alert rule is to configure a query condition. For example, for Prometheus data sources, PromQL is configured, and for ClickHouse data sources, SQL is configured. Then a threshold is set (in the Prometheus scenario, the threshold is included in PromQL and does not need to be configured separately). An alert will be triggered when the threshold is reached and the duration condition is met.
The alerting engine creates a goroutine (coroutine) for each rule, periodically queries the data source, and judges whether the alert conditions are met. Taking the Prometheus data source as an example, its principle is:
- Nightingale periodically calls the
/api/v1/queryinterface of the data source, passing the current time and PromQL as query conditions to this interface. - If the data source returns multiple records, it is likely that multiple alert events will be generated. Next, the duration needs to be considered. If the duration is 0, the alert event is generated immediately. If the duration is greater than 0, this record will be put into a cache, and the alert event will be generated only when the duration condition is met. During the duration, if the data is not found in subsequent execution cycles, this record will be deleted from the cache, and no alert event will be generated.
A common problem here is that the alerting engine does not find data during the query, so it cannot generate an alert event, but later investigation finds that there was data meeting the threshold at that time, which is puzzling. There may be two reasons for this situation:
- It is caused by the delay in reporting monitoring data. Here, Nightingale is just a client, and the data source is the server. If the data source does not return data, you need to check the server side to see why the data is not returned, which is usually due to various delays in the data.
- The query timed out. Relevant logs can usually be seen in the log file. You can increase the query timeout time on the data source configuration page, or check why the data source returns slowly. In addition, there may be hardware problems, such as network card packet loss between the client and the server. For timeout logs, you can search for the keyword:
alert-${datasource-id}-${alert-rule-id}
Among them:
${datasource-id}is the ID of the data source, which can be seen on the data source details page.${alert-rule-id}is the ID of the alert rule, which can be seen in the URL when editing the alert rule.
When troubleshooting alert issues, first check whether an alert event is generated. If an alert event is generated, it means the alert rule is fine, and then check the subsequent notification-related issues. If no alert event is generated, it is a problem with the alert rule and data source. First, confirm the configuration of the alert rule before considering other things.
Event Persistence
After an alert event is generated, it needs to be written to the DB (usually MySQL), so that you can see this event in the alert event list. Sometimes the writing may fail, and if it fails, it is usually reflected in the logs. You can check the WARNING and ERROR logs.
Associating Alert Rules with Notification Rules
After an alert event is generated, which subsequent notification rule should it follow? That is, how to establish an association between alert rules and notification rules? There are two ways to establish the association:
- Configure notification rules directly in the alert rule. That is, all alert events generated by this alert rule will follow these notification rules.
- Do not configure notification rules in the alert rule, but configure subscription rules, that is: filter alert events according to various conditions in the subscription rule, and the filtered alert events will follow the notification rules configured in the subscription rule.
Both methods are acceptable. The former is more intuitive, and it is recommended to use the former if there are no special requirements. However, for some global event processing, for example, if you want all alert events generated in Nightingale monitoring to go through a Callback processor, you can use a subscription rule to subscribe to all alert events, uniformly associate a global notification rule, and configure the Callback processor in this global notification rule.
Notification Rule Configuration
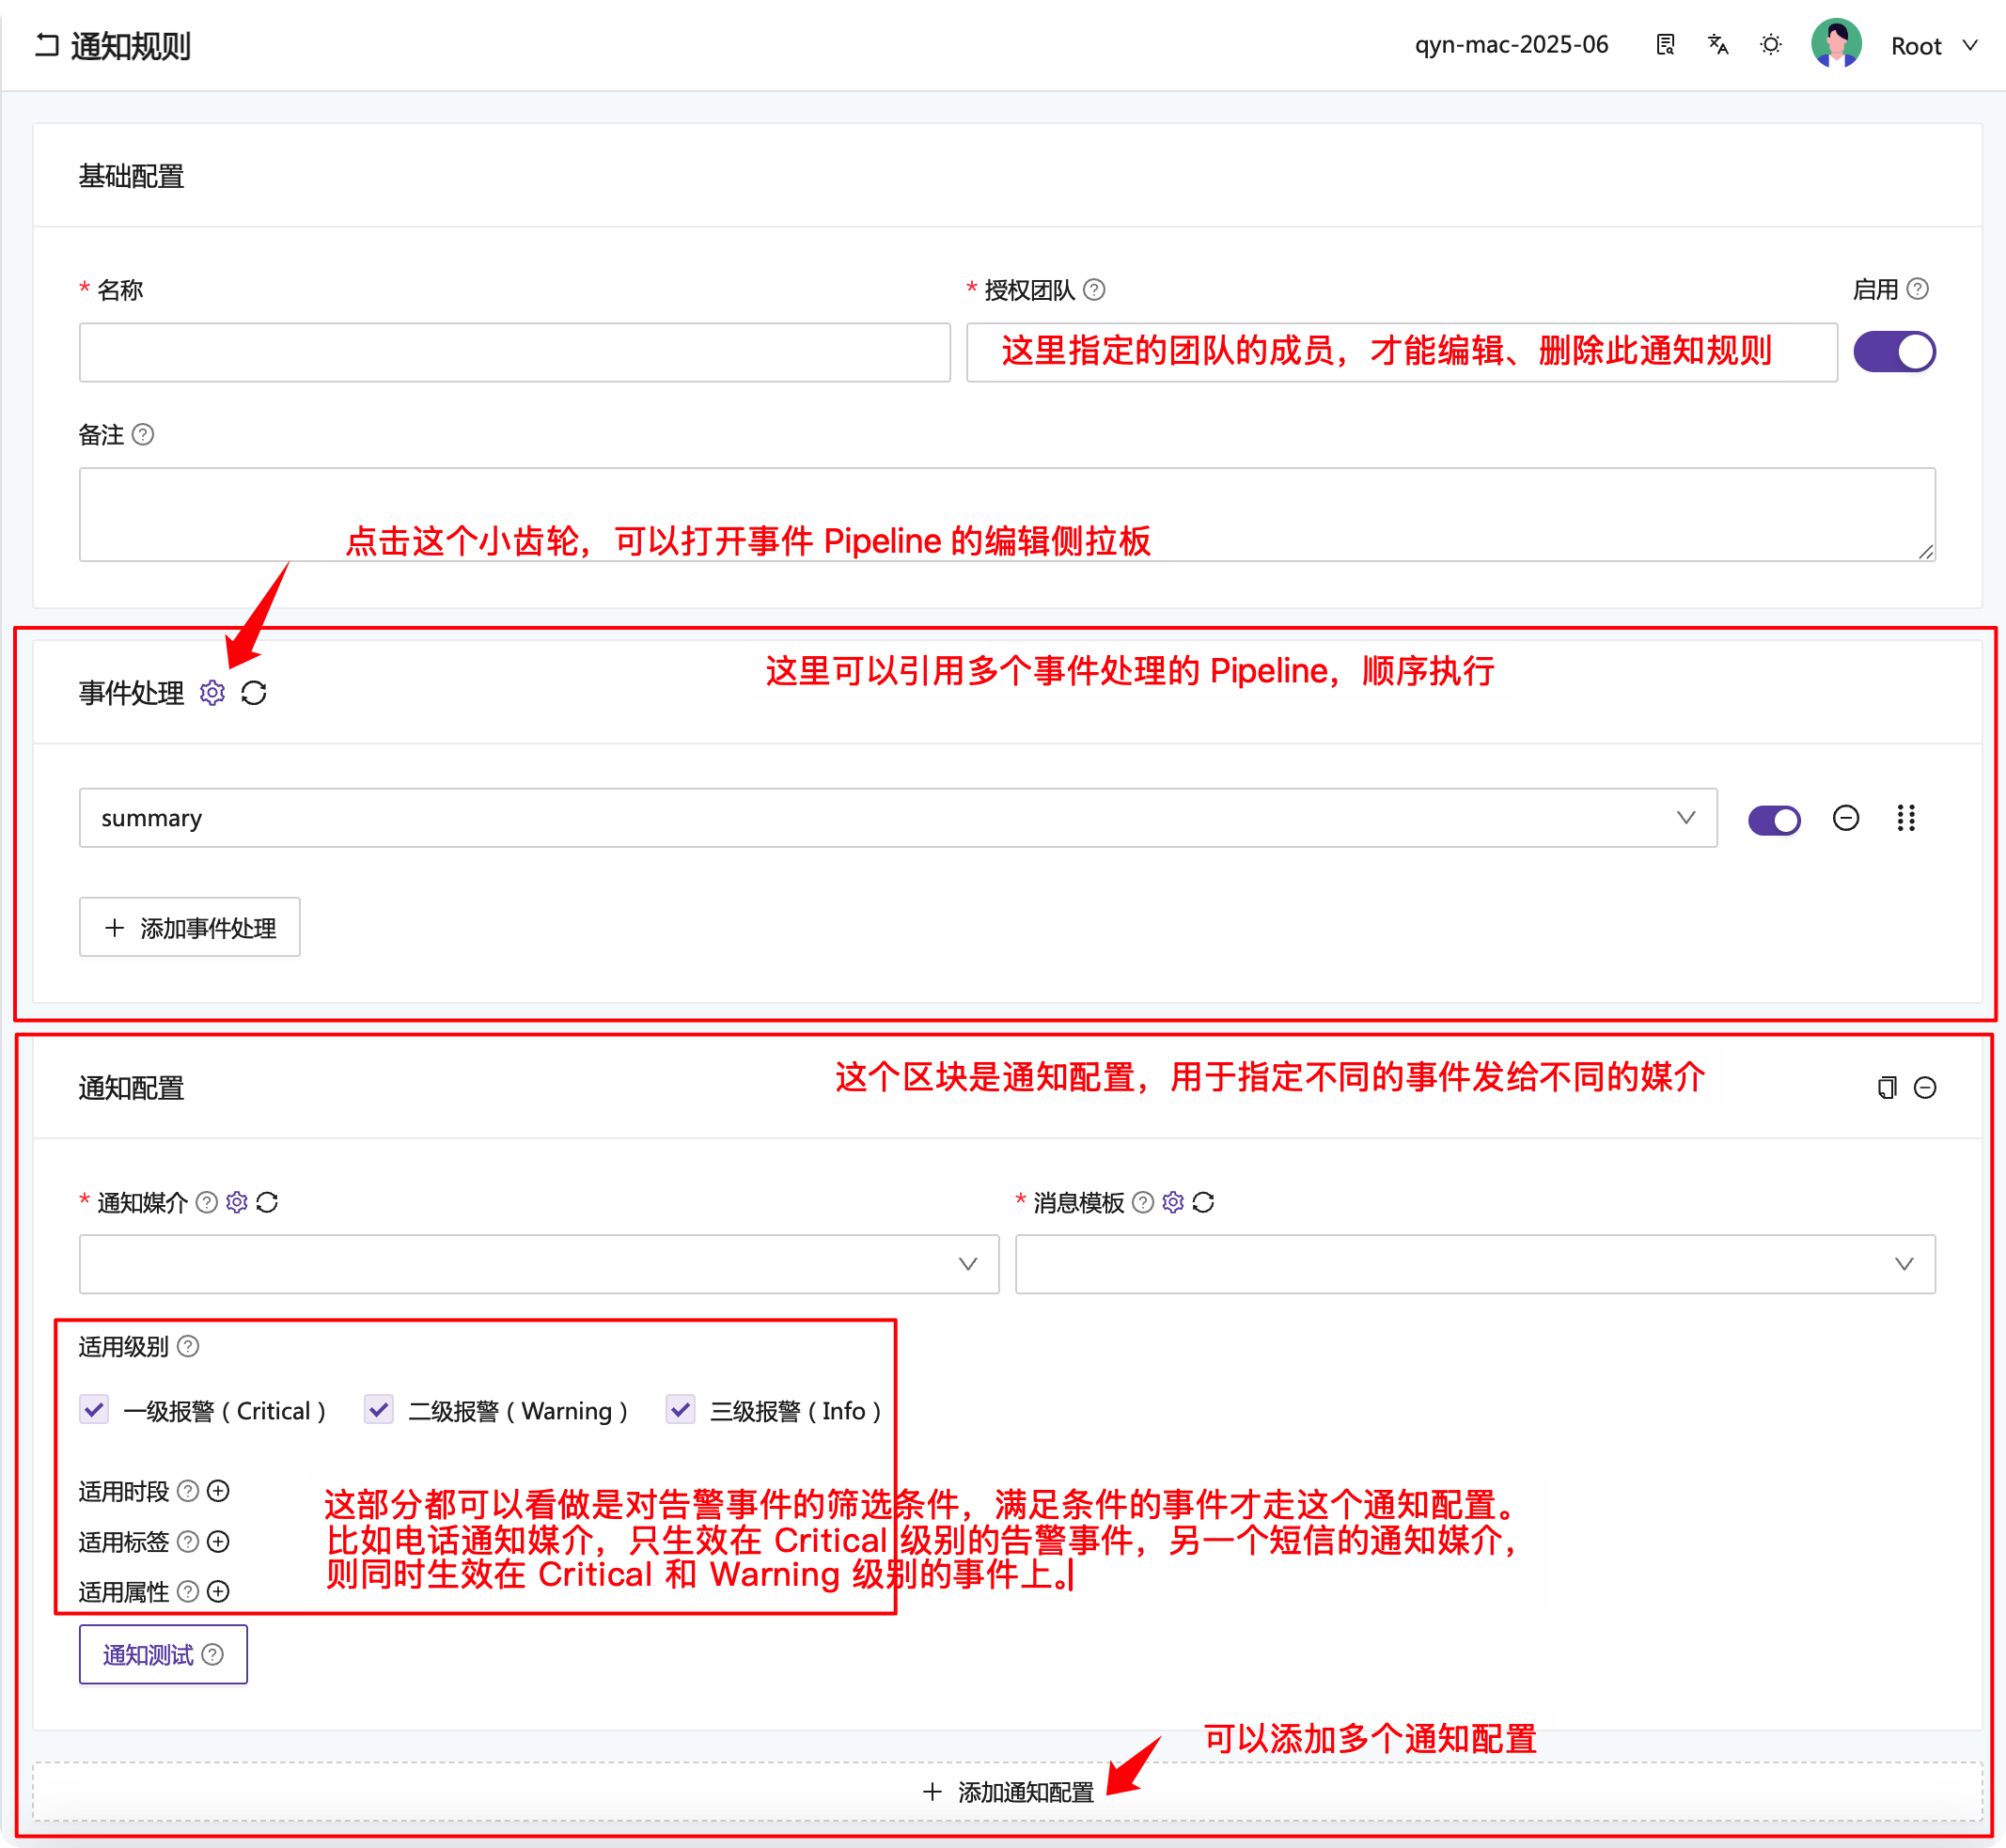
The following figure is the editing page of notification rules, where I have marked the functions of each block:

Most form items have a small question mark icon next to their titles. Hovering the mouse over it will display prompt information, which you can refer to for configuration.
💡 This page contains some notification test buttons. After clicking, you can select the generated alert events to test the notification rules, which is convenient for you to quickly verify whether the notification rules meet expectations. In addition, it should be noted that alert event persistence occurs before the notification rule, so each event processor in the notification rule will not modify the alert events in the DB.
Event Processors
💡 The event Pipeline does not have a separate menu entry. As part of the notification rule, you can click the small gear icon in the “Event Processing” block on the notification rule editing page to expand the event processor configuration sidebar.
Event processors are an advanced mechanism that allows you to perform various operations on alert events, such as:
- Relabel alert events, split some labels, modify some labels, etc.
- Update alert events: Nightingale sends the alert event to a third-party (such as CMDB) interface, and the third party can modify the alert event and return the modified content to continue the subsequent event processing logic, facilitating integration with external systems.
- Drop alert events: Some alert events do not need to be notified, and complex judgments can be made here to drop those that meet the conditions.
- Generate AI summaries: Send alert events to DeepSeek, etc., let AI help generate summaries and solutions, put the AI-generated content into the event, and send it out through notification media later.
Two concepts to note here:
- The event processing Pipeline is the sidebar expanded by clicking the button next to “Notification Rule - Event Processing”, which contains the list of Pipelines.
- Each Pipeline can contain multiple Processors. To improve reusability, you can also simply have each Pipeline contain only one Processor.
Each processor has a documentation link on the page. Clicking it will display detailed documentation. You can also refer to the materials in the following two links:
- Event Processor Description
- Custom Notification Media
- Open Source Nightingale Monitoring Implements Alert Silence During Release
Notification Configuration
This part has been explained earlier, so it will not be repeated here. Please refer to: