API
This article introduces how to use API to call the interfaces of Nightingale monitoring system. There are mainly two types of interfaces: one is page operation interface, which imitates user operations on the page through API, and the other is data push interface, for example, if your own program collects monitoring data and wants to push it to Nightingale.
Page Operation Interfaces
Page operation interfaces mainly simulate user operations on the page, such as creating alarm rules, modifying machine tags, modifying machine remarks, adjusting the business group that the machine belongs to, etc. All operations that users can perform on the page can be completed through API, and you can use these interfaces to achieve automated operations.
Obviously, there are two prerequisites for calling the API:
- Complete authentication
- Understand which interfaces are available and what parameters each interface has
Complete Authentication
Here we directly explain the authentication method for versions above v8.0.0-beta.5, which is the personal center token method, and it is the simplest way.
1. Modify the Configuration File
Modify Nightingale’s configuration file etc/config.toml, ensure that HTTP.TokenAuth is configured and Enable is set to true, as shown below:
...
[HTTP.RSA]
OpenRSA = false

[HTTP.TokenAuth]
Enable = true

[DB]
...
2. Obtain Token
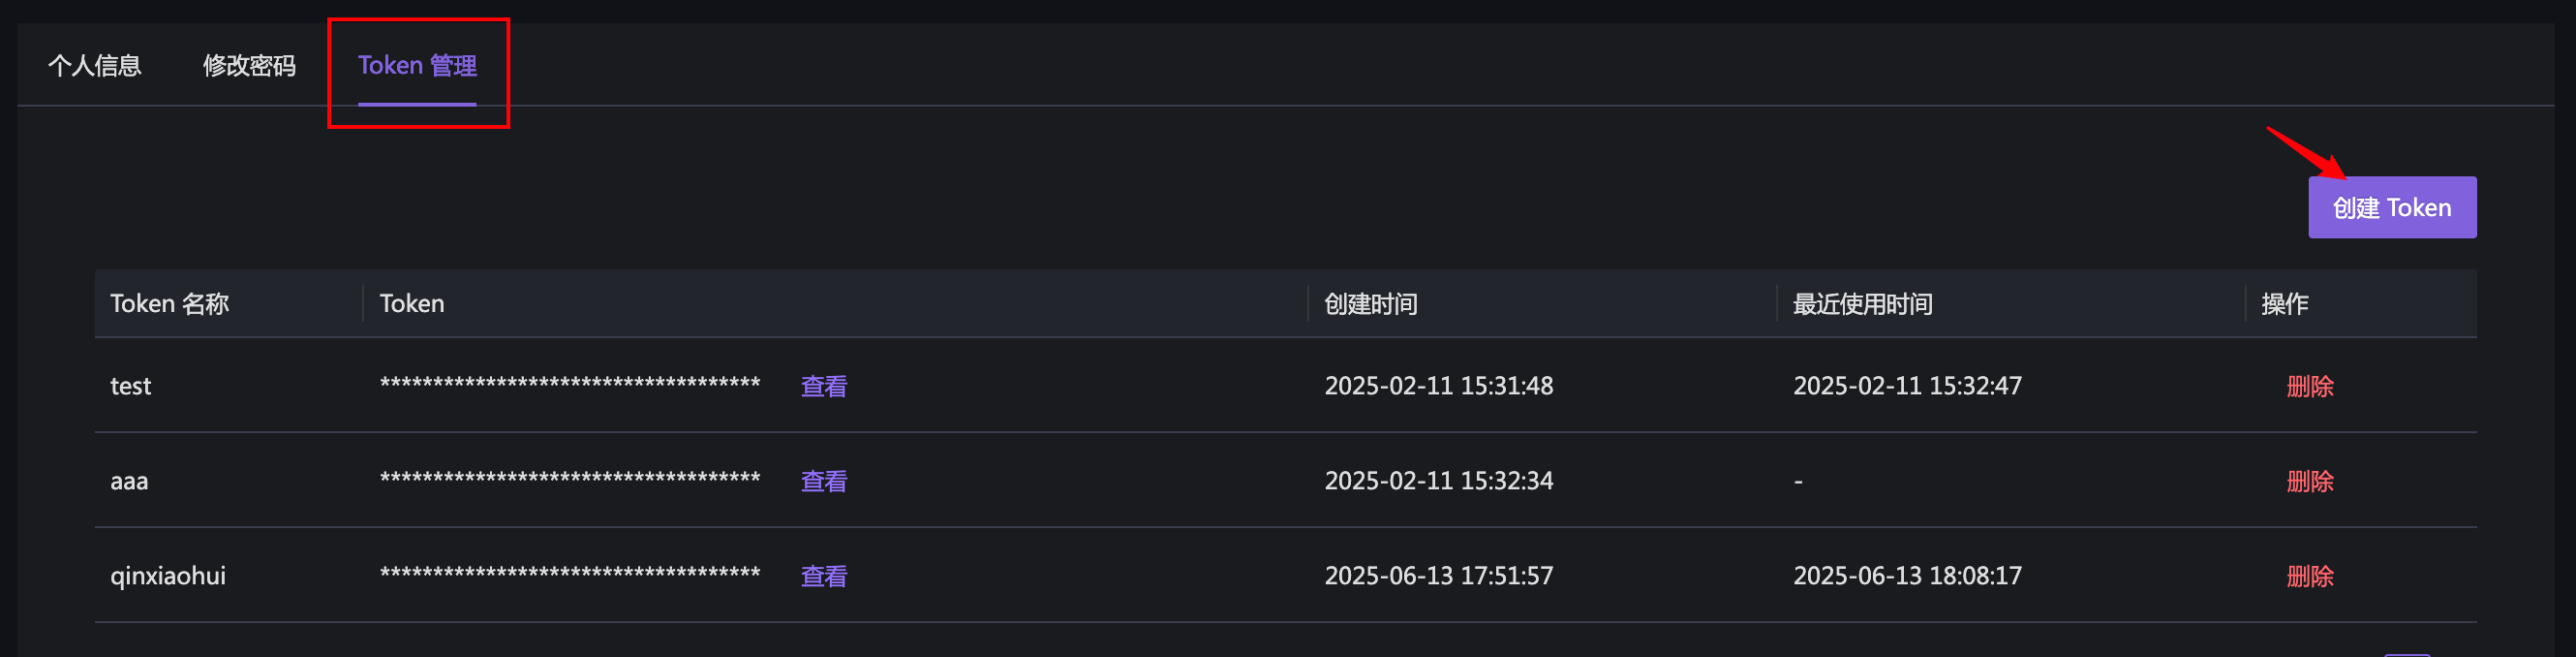
Log in to Nightingale monitoring, click the avatar in the upper right corner, enter the personal information page, click the “Token Management” tab, then click “Create Token”, give it a random name, and you can get a Token.
3. Use Token
When calling the API, you need to add the X-User-Token field in the Header of the HTTP request, and the value is the Token you just created. Example of calling API with cURL command:
curl -s -X GET "http://<NIGHTINGALE_HOST><API_URL_PATH>" \
-H "X-User-Token: <YOUR_TOKEN>" \
-H "Content-Type: application/json"
Let’s test the interface for obtaining personal information:
curl -s -H "X-User-Token: e6897d32-c237-4d27-a0fc-786345b682ea" -H "Content-Type: application/json" 'http://10.99.1.106:8003/api/n9e/self/profile' | python3 -m json.tool
{
    "dat": {
        "id": 1,
        "username": "root",
        "nickname": "Root",
        "phone": "",
        "email": "qinxiaohui@flashcat.cloud",
        "portrait": "/image/avatar1.png",
        "roles": [
            "Admin"
        ],
        "contacts": {
            "wecomid": "qinxiaohui"
        },
        "maintainer": 0,
        "create_at": 1733229739,
        "create_by": "system",
        "update_at": 1749811268,
        "update_by": "root",
        "belong": "",
        "admin": true,
        "user_groups": null,
        "busi_groups": null,
        "last_active_time": 1749811088
    },
    "err": ""
}
As above, the content is returned normally, indicating success. If you want to write a program to call the API, you need to check:
- Whether the HTTP status code returned by Nightingale is 200. If the status code is not 200, it indicates that the request failed. At this time, you can print the Response Body to view the specific error information.
- If the status code is 200, the Response Body must be JSON. At this time, you also need to check whether the
errfield in the JSON data is empty. If it is not empty, there is a problem.
Understand Available Interfaces
Open the Nightingale page directly with Chrome, press F12 to open the developer tools, switch to the Network tab, then operate on the page, such as creating an alarm rule or modifying machine tags. You will see many API requests in the Network, which are the API interfaces of Nightingale. For example:
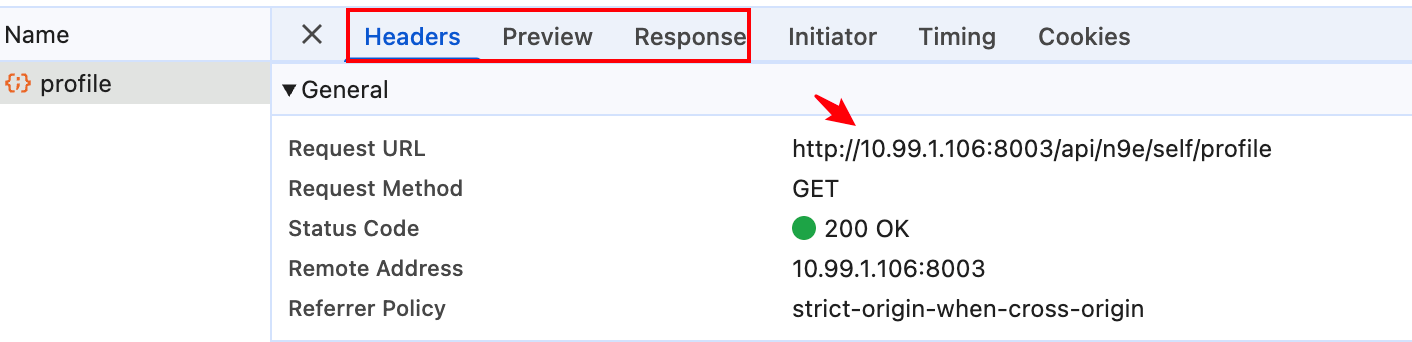
- You can see the Request Method and URL under Headers
- You can see the returned content under Response
The above interface does not have any Query string parameters. If there are Query string parameters, they are usually displayed in the URL. In addition, if it is a POST request, you need to study the format of the Request Body. At that time, a Payload tab will appear, and you can see the content format of the Request Body under Payload.
This method is much better than the interface document. The interface document is often forgotten to be updated, and the differences between different versions are often forgotten to be explained. However, by viewing Chrome in this way, the information is absolutely 100% accurate. It is clear which interfaces there are and what parameters they have. Every operation and maintenance personnel and back-end R&D should know this method.
Data Push Interfaces
There are usually two ways for your own program to expose monitoring data: one is to embed the Prometheus SDK, expose the /metrics interface, and then use Prometheus or Categraf to scrape (called PULL mode); the other is to directly call Nightingale’s API interface to push monitoring data (called PUSH mode). Nightingale supports a variety of data receiving interfaces, including OpenTSDB, Open-Falcon, PrometheusRemoteWrite, Datadog and other protocols.
Push Example
Taking the OpenTSDB protocol as an example, the Nightingale interface path is /opentsdb/put, the HTTP Method is POST, and the monitoring data you want to report is placed in the Request Body. The format example is as follows:
[
	{
		"metric": "cpu_usage_idle",
		"timestamp": 1637732157,
		"tags": {
			"cpu": "cpu-total",
			"ident": "c3-ceph01.bj"
		},
		"value": 30.5
	},
	{
		"metric": "cpu_usage_util",
		"timestamp": 1637732157,
		"tags": {
			"cpu": "cpu-total",
			"ident": "c3-ceph01.bj"
		},
		"value": 69.5
	}
]
Obviously, the outermost layer of JSON is an array. If you only report one piece of monitoring data, you can also omit the outer brackets and directly report the object structure:
{
  "metric": "cpu_usage_idle",
  "timestamp": 1637732157,
  "tags": {
    "cpu": "cpu-total",
    "ident": "c3-ceph01.bj"
  },
  "value": 30.5
}
The server will judge whether the reported data is an array or a single object by checking whether the first character is [, and automatically perform the corresponding decoding. If you think that the reported content occupies too much bandwidth, you can also gzip compress the Request Body in your program, and add the Content-Encoding: gzip Header in the HTTP Header.
You can Google or ask GPT for the meaning of each field, with the keyword “the meaning of each field in OpenTSDB data format”. Here I will briefly explain:
- metric: The name of the monitoring indicator, usually an English word, and multiple words are connected with underscores, such as
cpu_usage_idle - timestamp: Timestamp, in seconds, indicating the collection time of monitoring data
- tags: Tags, usually a map structure, where the key is the tag name and the value is the tag value, used to describe various dimension information or meta-information of the indicator
- value: The value of the monitoring data, usually a number, indicating the value of the indicator
🟢 Note the
identtag.identis the abbreviation of identity, representing the unique identifier of the device. If there is anidenttag in the tags, n9e will consider that this monitoring data comes from a certain machine, and will automatically obtain the value ofidentand register it in Nightingale’s machine list.
Other commonly used interface paths:
/openfalcon/push: Open-Falcon data receiving interface/prometheus/v1/write: Prometheus Remote Write data receiving interface
How to Authenticate
If your Nightingale is exposed to the public network, then everyone can push monitoring data to you, which is obviously unsafe. So we suggest:
- Do not expose Nightingale to the public network
- If you really need to expose it to the public network, use the HTTPS protocol and enable Basic Auth authentication at the same time
How to enable Basic Auth authentication? Configure in etc/config.toml:
[HTTP.APIForAgent]
Enable = true
[HTTP.APIForAgent.BasicAuth]
user001 = "Pa55word01"
user002 = "Pa55word02"
Your own program calls Nightingale’s interface to report monitoring data. At this time, your program is equivalent to an agent role, so it is related to the configuration of HTTP.APIForAgent.
- The Enable under
HTTP.APIForAgentmust be set to true to enable related interfaces; otherwise, calling those data reporting interfaces will result in a 404 Not Found error. - The configuration under
HTTP.APIForAgent.BasicAuthis the username and password, in the format ofusername = "password". You can set multiple users, and the authentication method for these users is Basic Auth. If there are no users configured underHTTP.APIForAgent.BasicAuth, it means that no authentication is required, and anyone can push data.
🔴 Note: There is also a
HTTP.APIForServiceconfiguration section next toHTTP.APIForAgent, which is used to provide some interfaces for n9e-edge, that is, the edge computer room deployment mode of Nightingale. If you are not using n9e-edge, you must disableHTTP.APIForService, that is, set Enable underHTTP.APIForServiceto false to avoid security risks.