I already have Prometheus / VictoriaMetrics
Register the store as a data source, keep scraping exactly as before, and get the first rule evaluating against it — no data moves.
Where this path ends: one alert rule evaluating against the time-series database you already run, with your scrape config untouched and not one byte of data moved. About 10 minutes.
Before you start
- Nightingale is running (if not, start at Quick start);
- the query endpoint of your Prometheus / VictoriaMetrics / Thanos / Mimir, and network access to it from the host running Nightingale;
- credentials, if the endpoint is behind auth.
1. Register the data source
Integrations → Data sources → Add → Prometheus.
Only two fields are required:
| Field | What to put in it |
|---|---|
| Name | Something you will recognise — rules pick the source by this name |
| URL | The query endpoint. The form lists the shape for each product |
The endpoint shapes (the same list the form shows):
Prometheus                    http://localhost:9090/
Thanos Querier                http://localhost:19192/
VictoriaMetrics single-node   http://{vmselect}:8428/
VictoriaMetrics cluster       http://{vmselect}:8481/select/0/prometheus/
Mimir query frontend          http://mimir:9009/prometheus
M3                            http://localhost:7201/
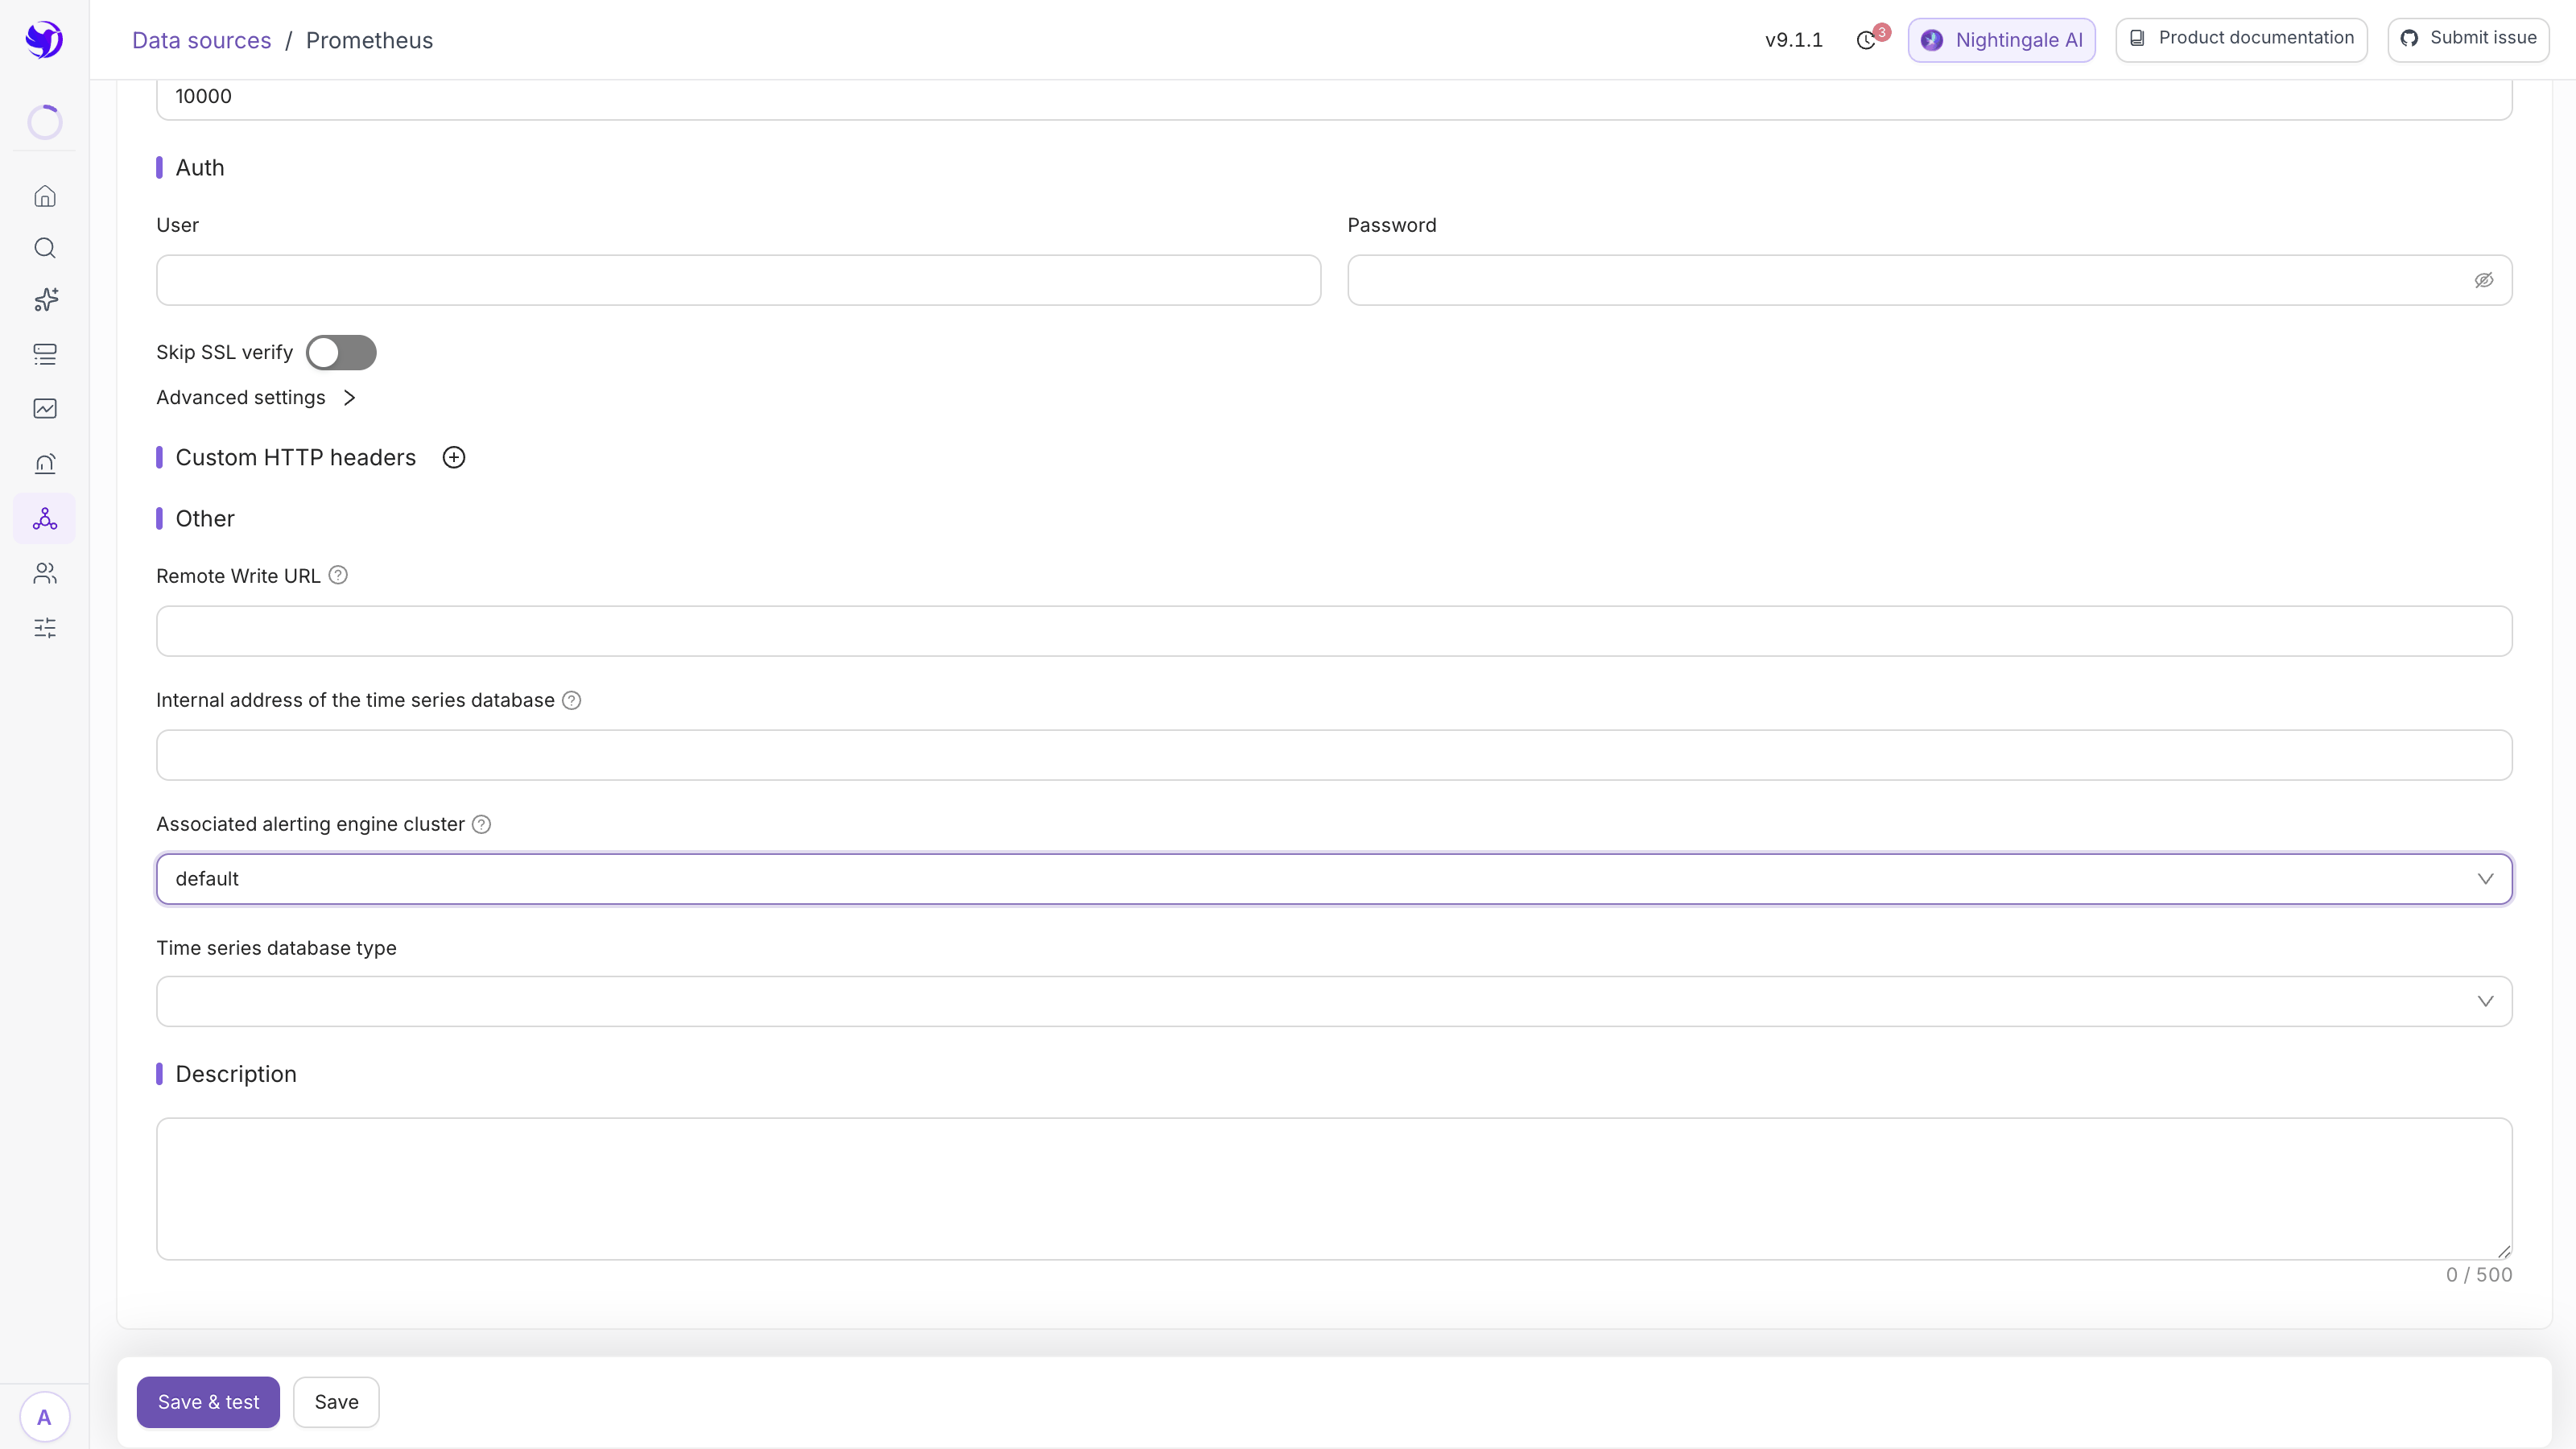
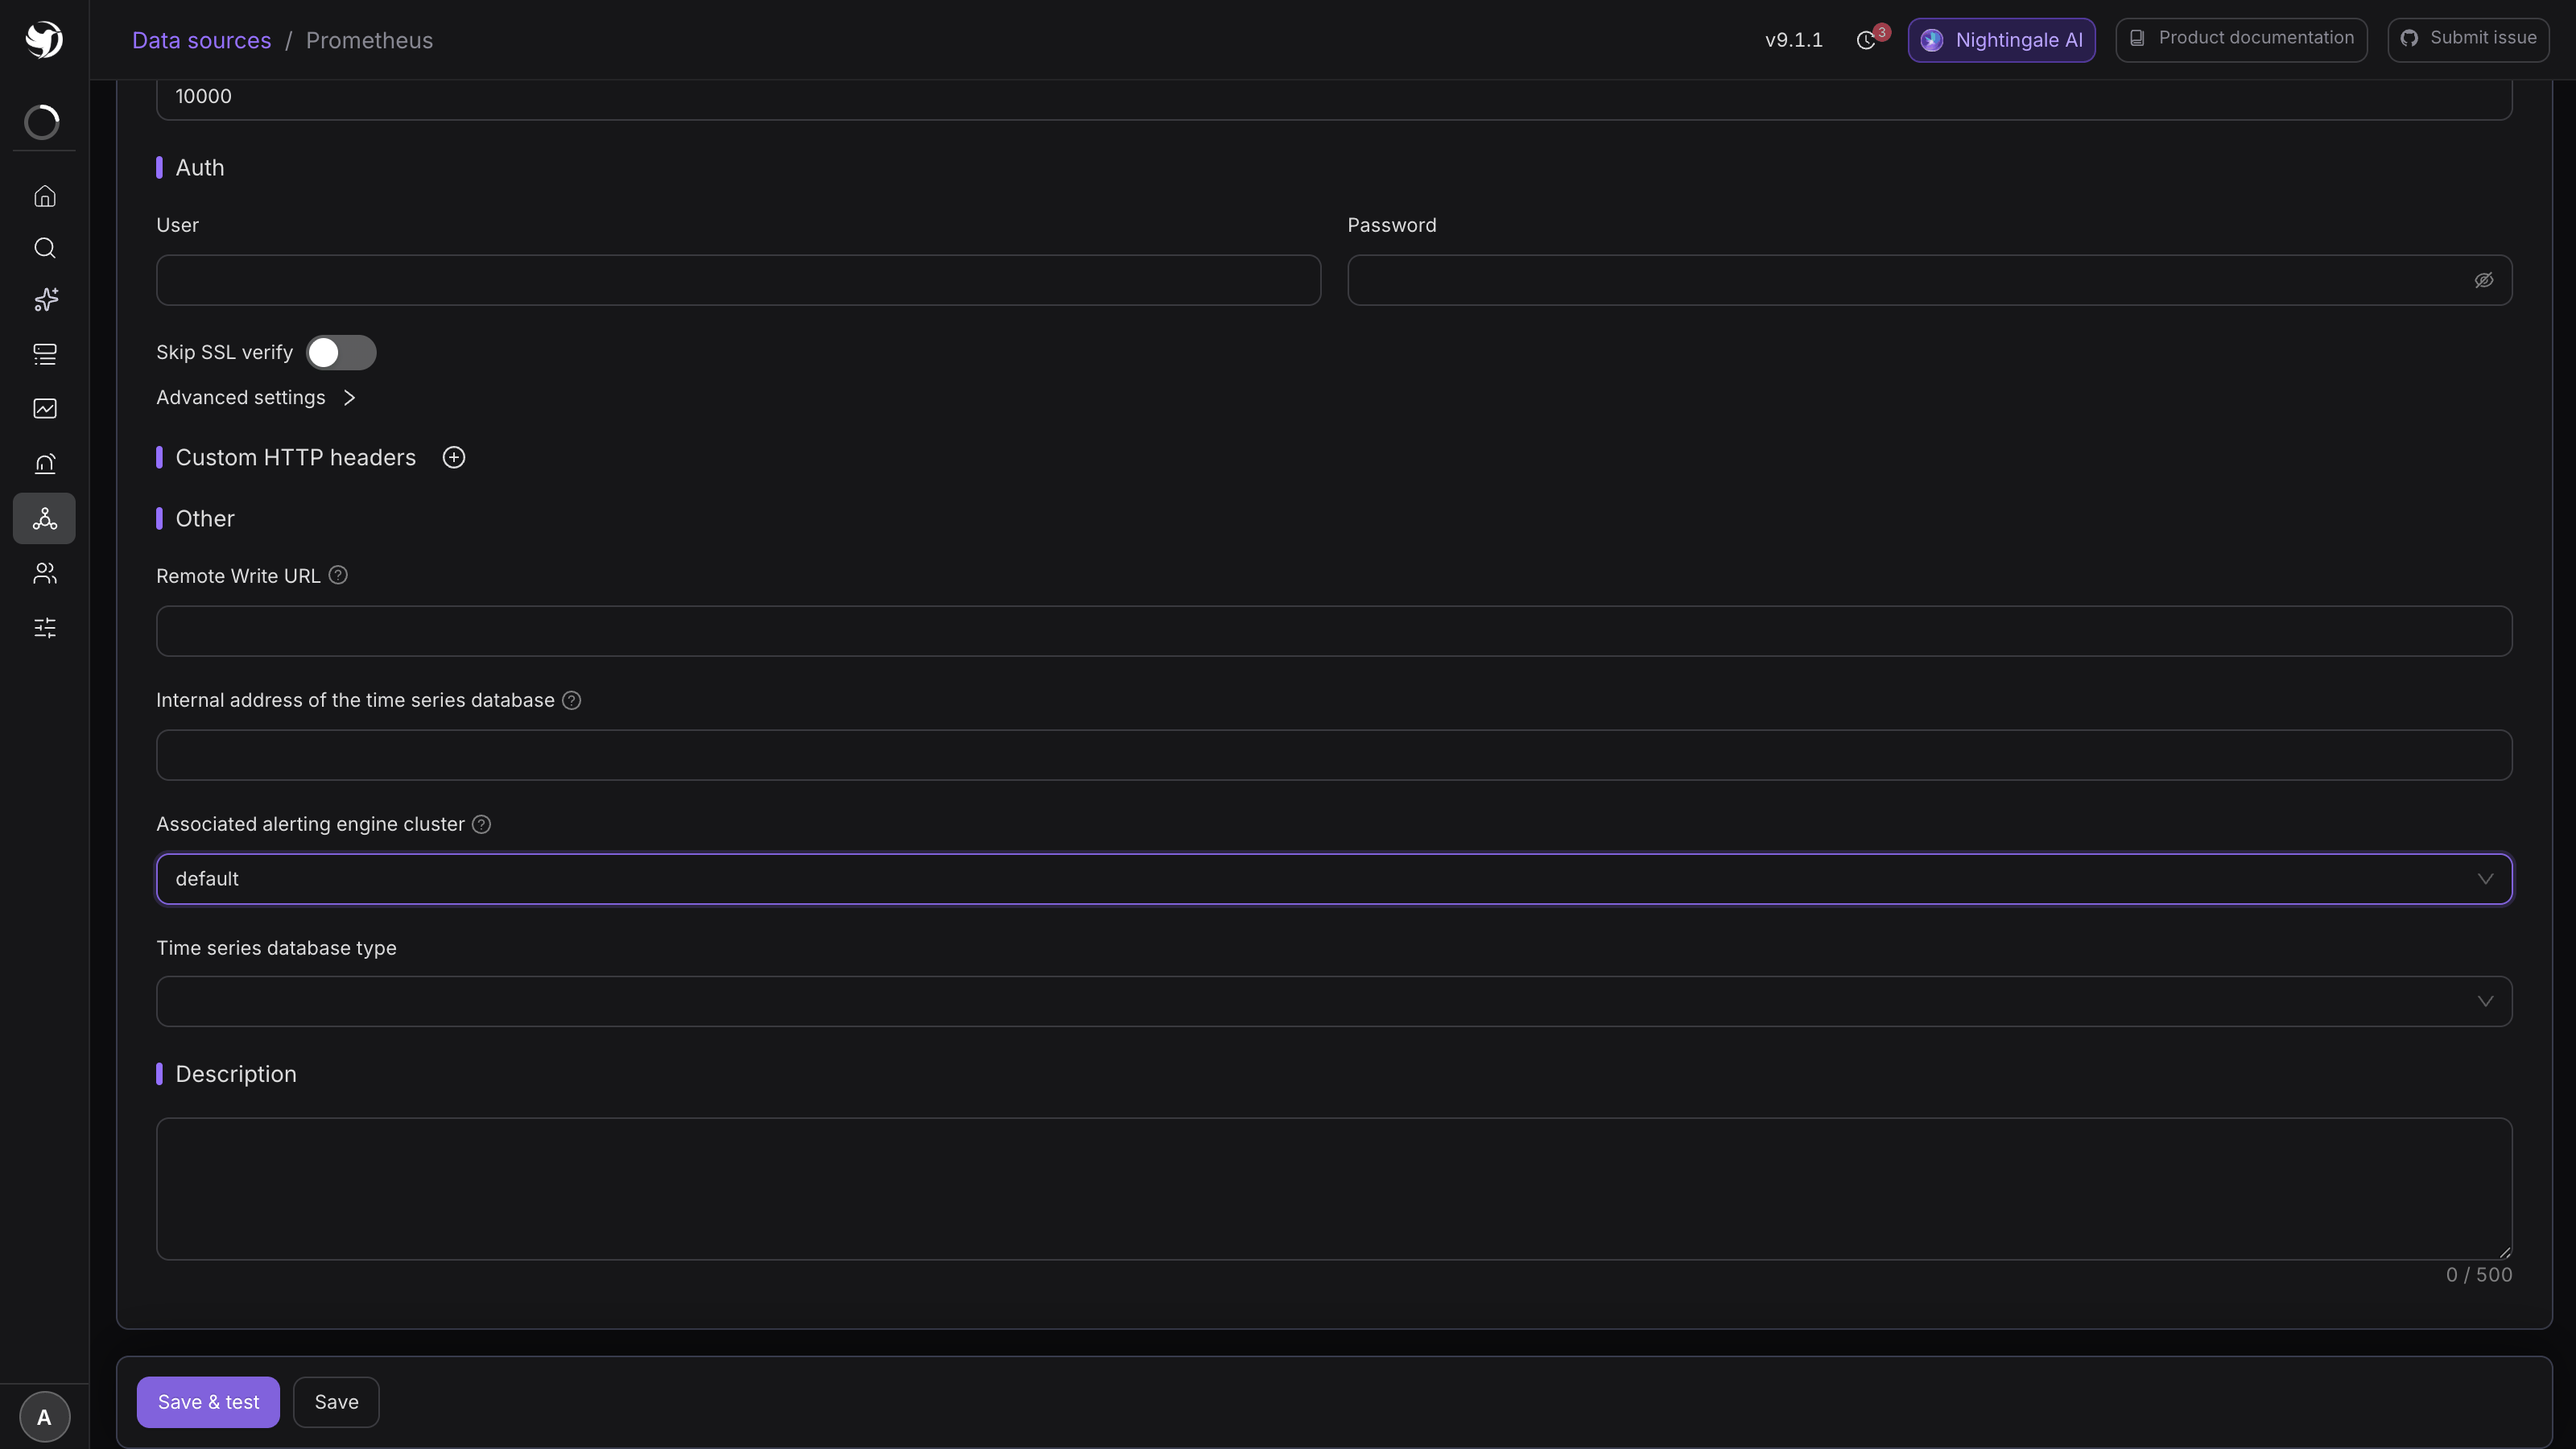
VictoriaMetrics, Thanos and Mimir all implement the PromQL HTTP API, so all three register as
Prometheus Like — there is no separate VictoriaMetrics type. For VictoriaMetrics, set Time
series database type at the bottom of the form to VictoriaMetrics; that only tunes how
dashboards query it.
If the endpoint uses basic auth, fill User and Password under Auth — the plain
password, not the bcrypt hash from Prometheus's web-config.yml. Turn on Skip SSL verify
for a self-signed certificate.
Click Save & test. A failed test is not saved, and the error names the step that failed.
2. Saving opens a guided dialog
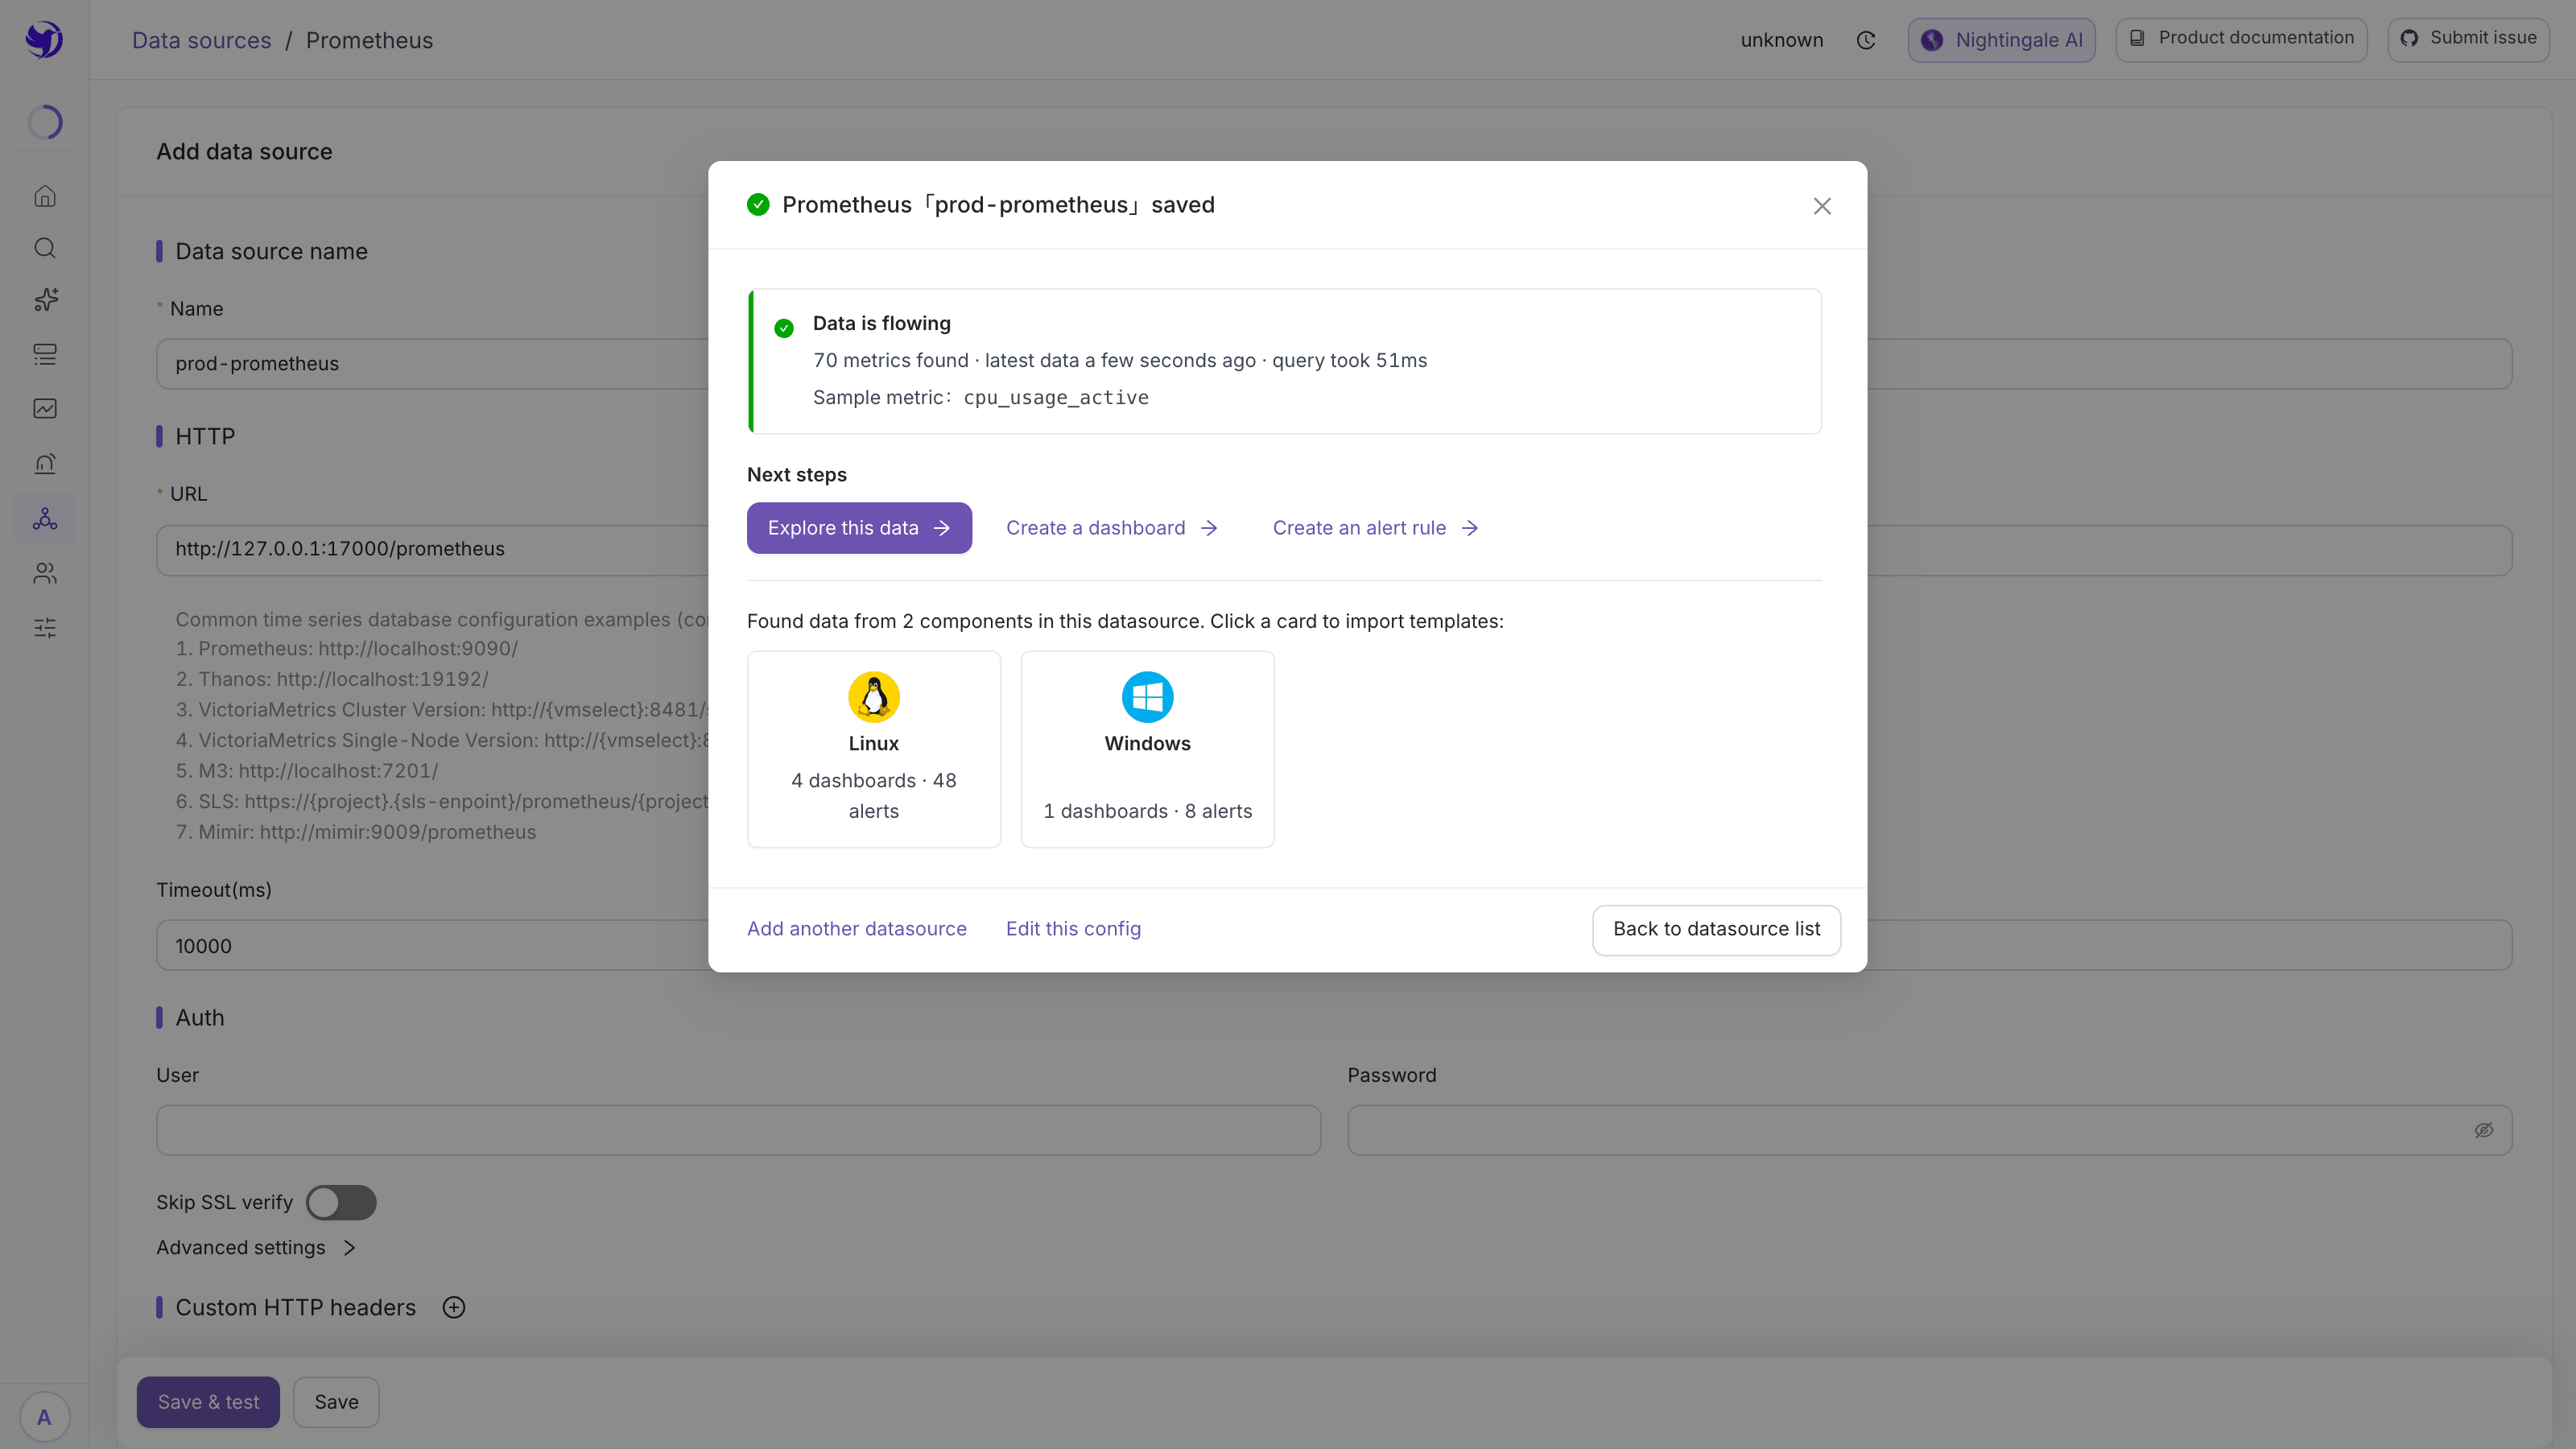
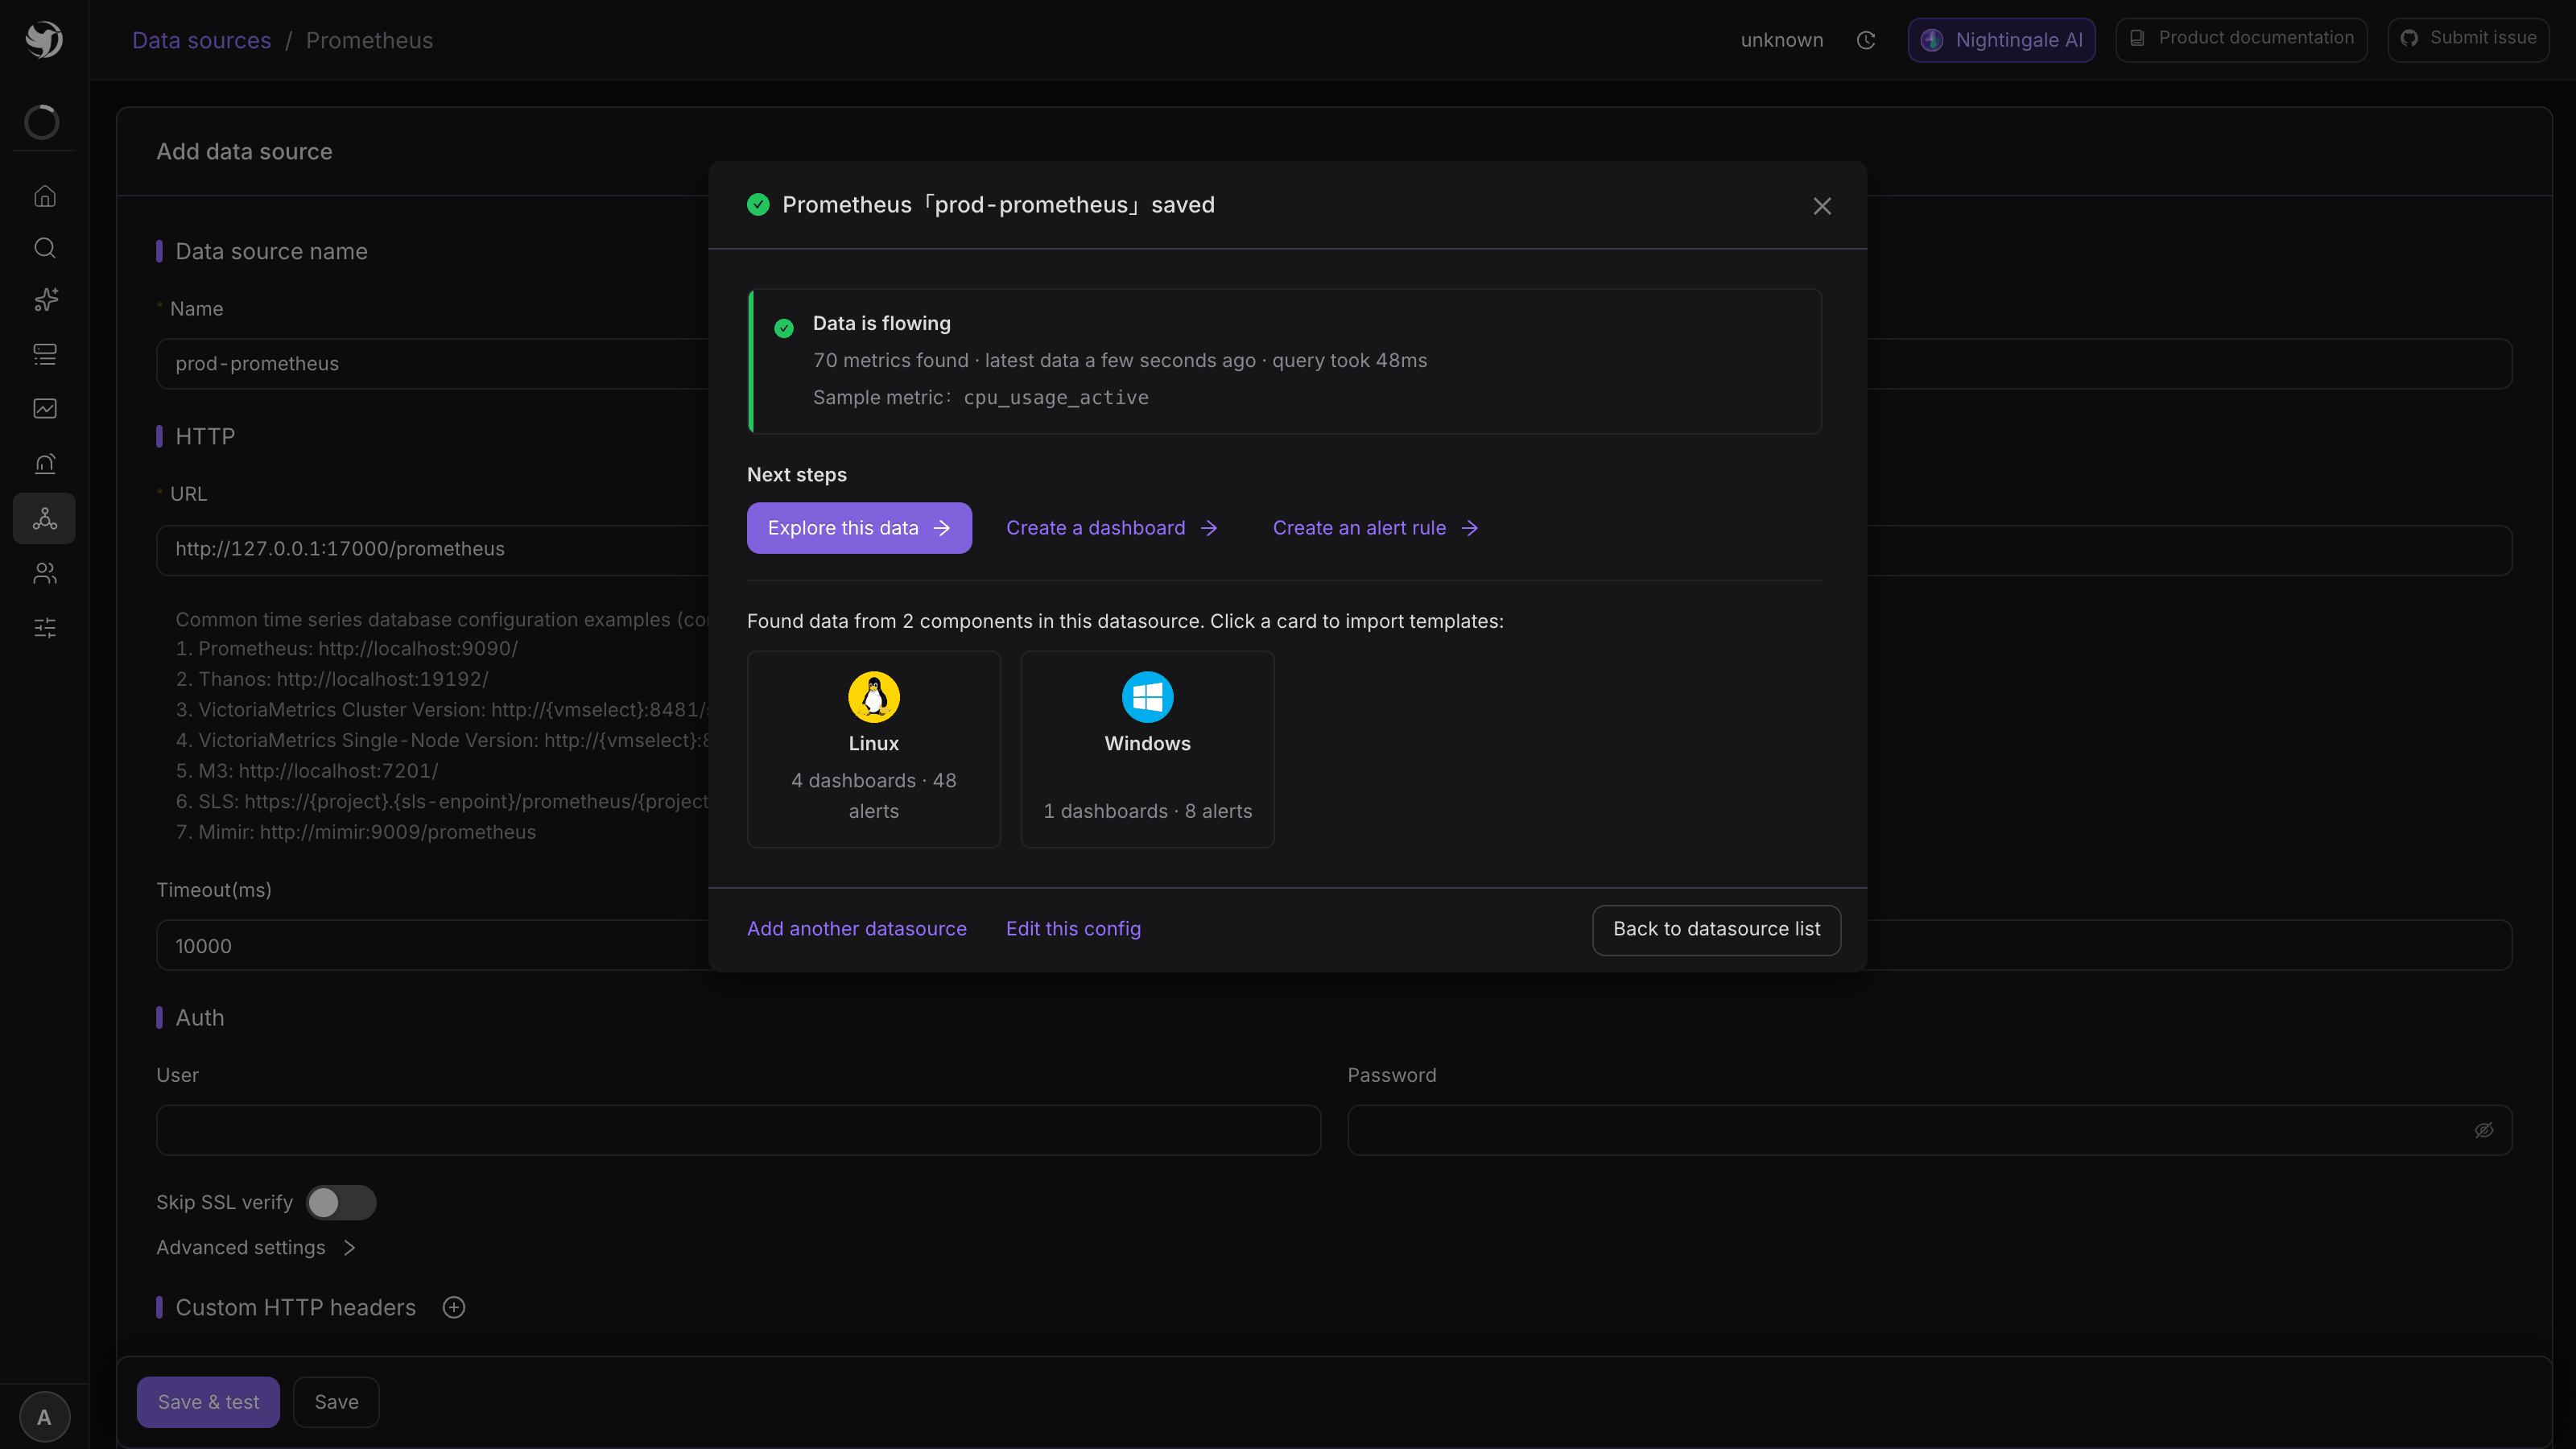
Saving does not drop you back on the list. A dialog opens and answers, right there, whether the source you just registered actually works — and offers the few things worth doing next.
Health check
The dialog runs a real query against the source as it opens. There are four verdicts:
| Verdict | What it means | What to do |
|---|---|---|
| Data is flowing | Also reports metric count, latest data time, query latency and a sample metric | Move on |
| Connected, but no metrics found | The endpoint answers, the store is empty | Usually nothing is writing yet — not a misconfigured source |
| Historical data exists, but nothing recent | Metrics are there, no recent samples | Check whether the collector is still running |
| Cannot reach the datasource | URL, credentials or network | Use Back to edit config in the dialog |
The health check only runs for Prometheus-family sources. Other types say it is not available — run a query in the Metrics explorer instead.
The three "Next steps" buttons
All three open in a new tab, so the dialog and its verdict stay put:
- Explore this data opens the Metrics explorer carrying the sample metric the health check found, so there is a chart on arrival and no first query to invent;
- Create a dashboard / Create an alert rule land on the matching list page, which shows a "Datasource name is ready" banner telling you to pick a business group first — both Add buttons need that context.
Component template matching
If the source holds data for components Nightingale knows, the dialog lists them at the bottom, each with how many dashboards and rules it carries.
The matching runs on sentinel metrics: every built-in template picks one to three representative metrics from its own queries, they go to your source as a single query, and any that returned a sample in the last five minutes marks its component as present. So the list is what you are actually collecting, not a catalogue of everything on offer.
Click a card to open the import dialog:
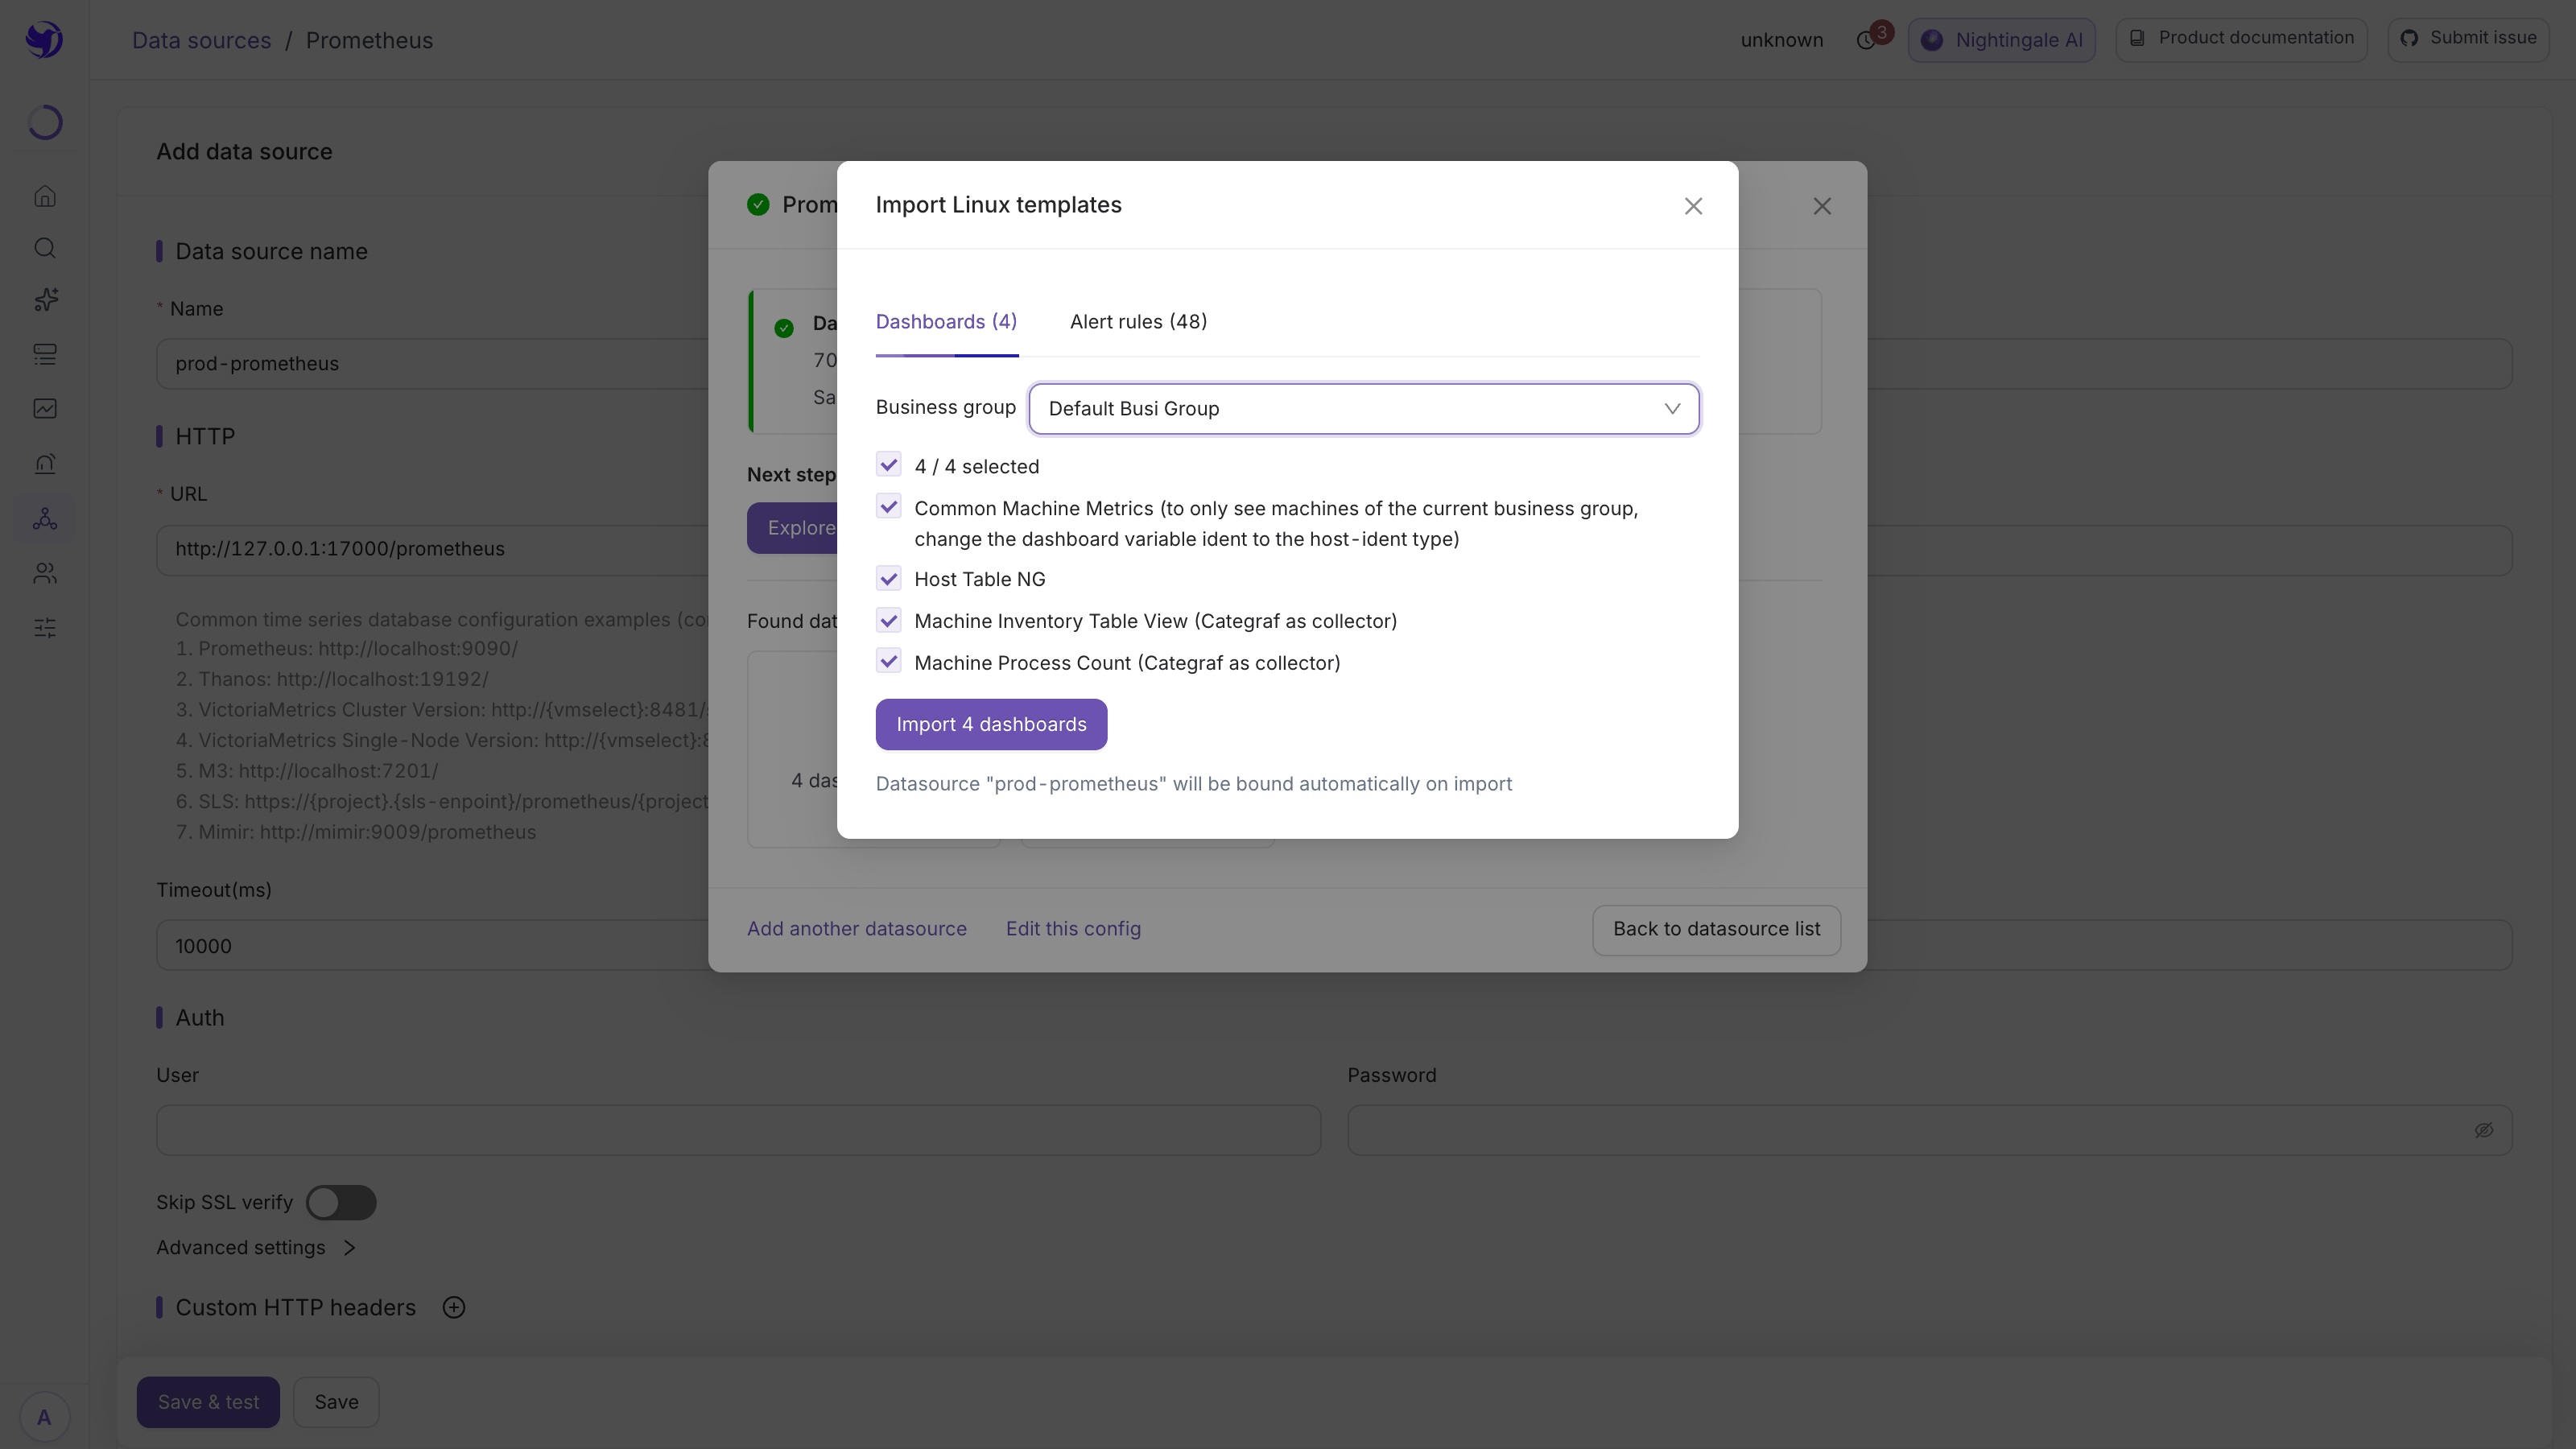
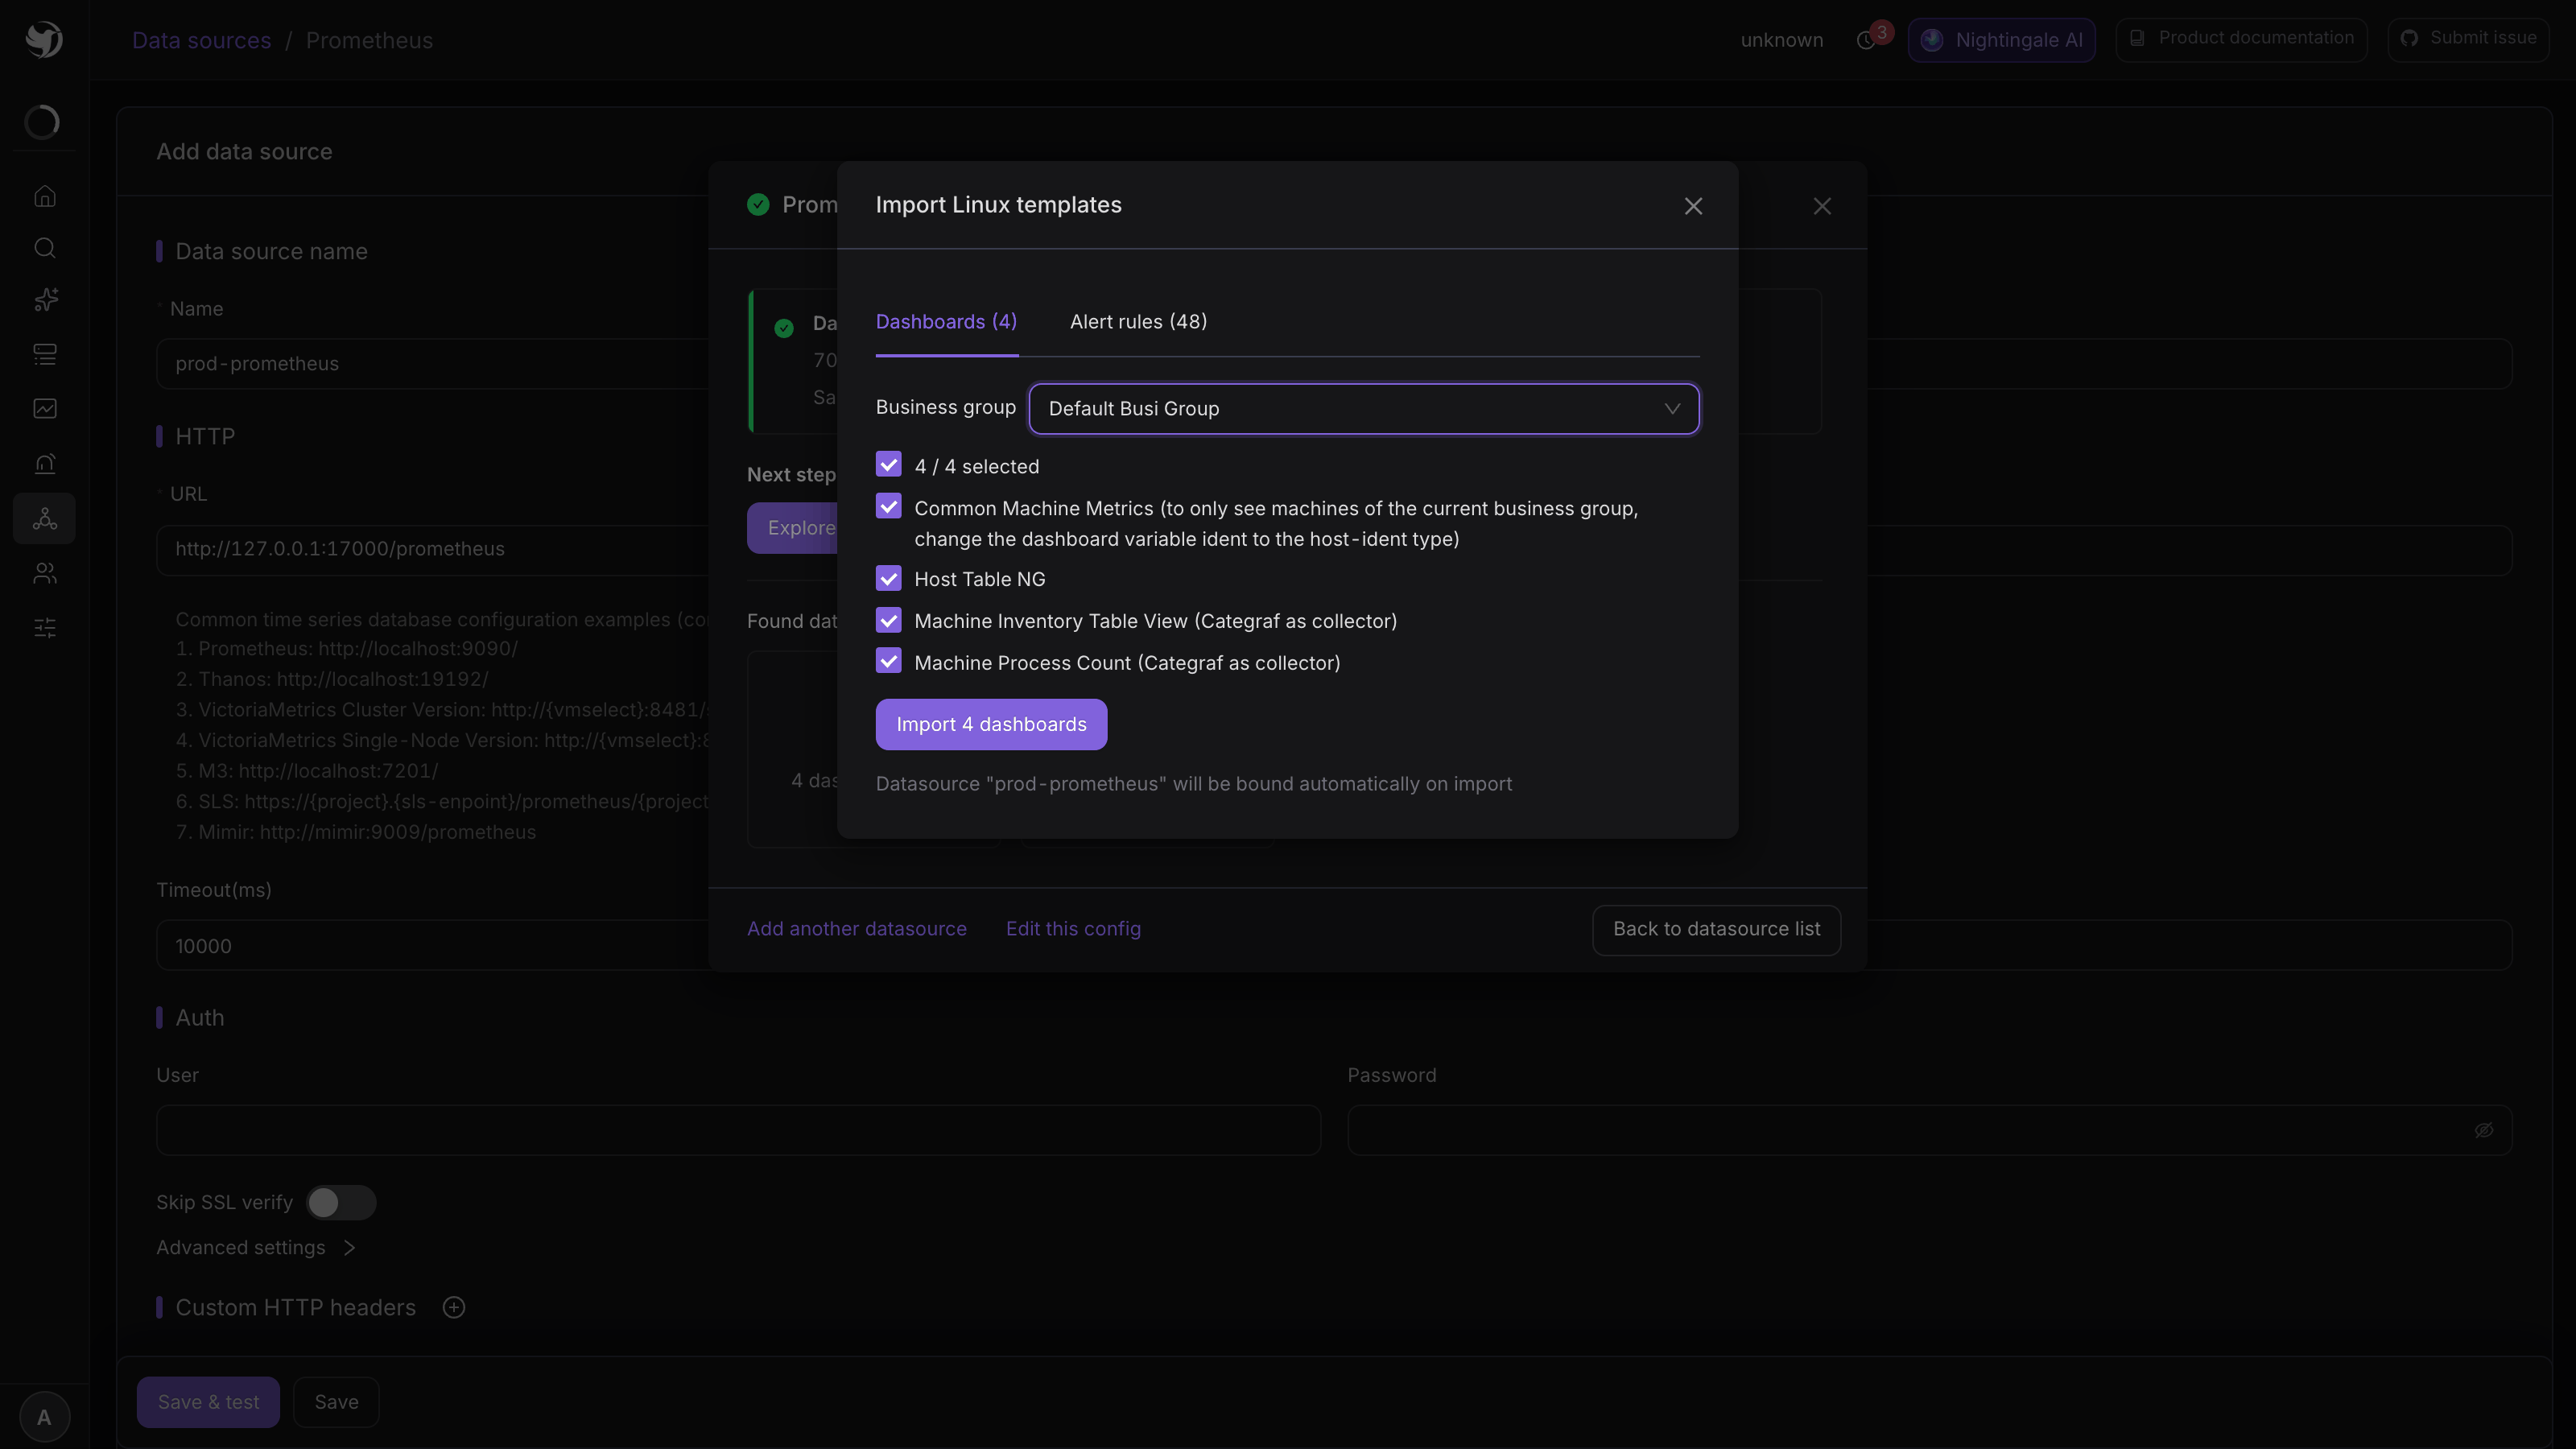
Pick a business group, tick the dashboards or alert rules to bring in, and the import binds them to the source you just saved. The other two import entry points, and the templates themselves, are covered in Import dashboards and rules.
Reopening it later
Integrations → Data sources, then Data status on that row: same dialog, health check runs again. A disabled source is not probed, and the dialog says so rather than reporting it as broken.
3. Confirm you can actually query it
Explore this data in the dialog lands here. Coming in by hand: Explorer → Metrics, pick the source you just created, and run a PromQL query you know returns data:
up
A line on the chart means this half works. If nothing comes back, stop here — Data source connects but queries return no data.
4. Write the first rule
Alerts & Notifications → Alert rules → Add, select your data source, and write a query that will fire. Start with an expression that must be true, so you are testing the chain and not your threshold:
up == 1
Evaluation every 15s, for-duration 60s, severity S2. Save.
A minute later, Alerts & Notifications → Events should show events. That means data source → query → evaluation → event works end to end.
Then change that rule to a real threshold, or delete it — as written it never stops firing.
Next
- Get events to a person: Notifications
- Write rules properly: Alert rules
- Also monitor the hosts themselves: Start with Categraf