Metrics explorer
Ad-hoc PromQL against any registered source, with the same query editor rules use.
Where this page ends: one PromQL query running against any registered Prometheus-type source, a clear idea of why Table and Graph do not show the same numbers, and four ways to take that query somewhere useful.
1. Pick a source and run the first query
Explorer → Metrics (/metric/explorer) opens on the Explorer tab.
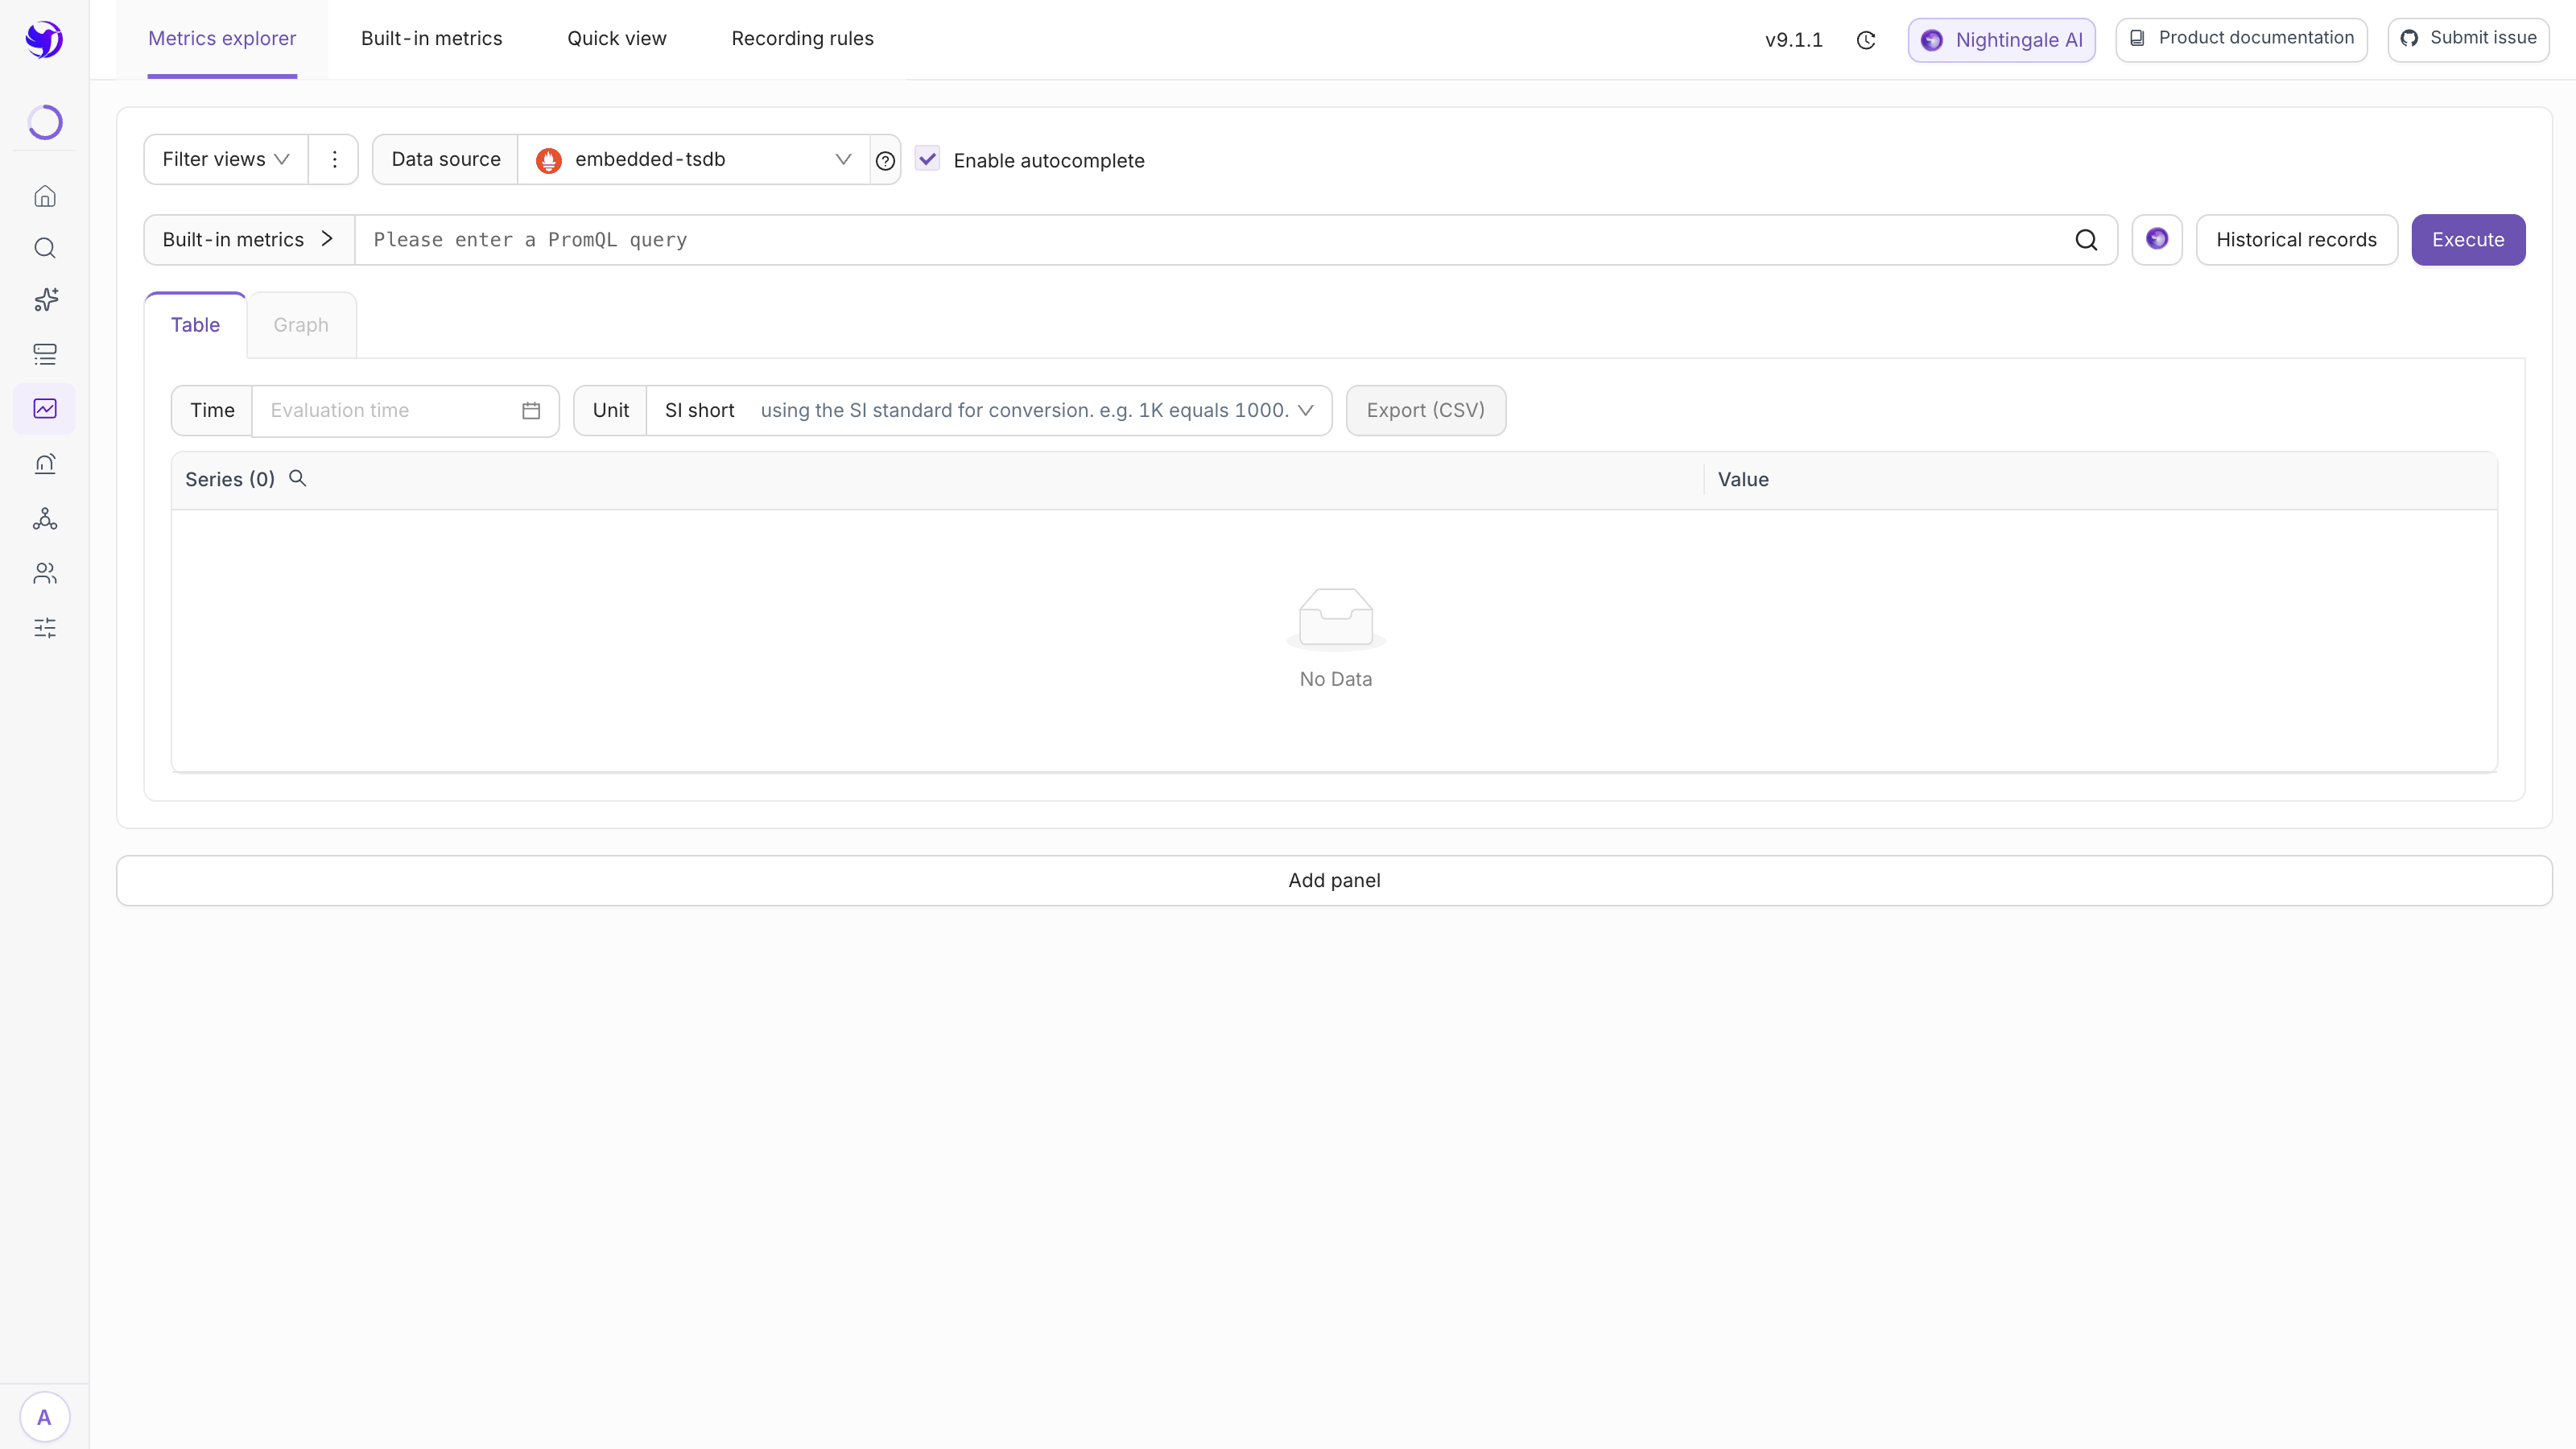
The top row:
| Control | What it does |
|---|---|
| Filter views | Saves a set of query conditions so you can pick them again later |
| Data source | Lists Prometheus-type sources only. A fresh install has exactly one, embedded-tsdb |
| Enable autocomplete | Completes metric names and labels in the input; turn it off when cardinality is very high |
Type PromQL into the box and click Execute:
up
Expected result: the Table tab lists series with their instant values, and "Series (N)" at the top left gives the count. If nothing comes back, start at Data source connects but queries return no data.
2. Table and Graph do not show the same data
This is the part people misread:
| Tab | What it queries | When to use it |
|---|---|---|
| Table | An instant query at one point in time — the raw reported values | Checking whether a metric is arriving at all, and whether its value and timestamp look right |
| Graph | A range query over a time window, resampled to a step | Looking at a trend |
The Table side has three more controls: Time (empty means now; set a moment to query that moment), Unit (display only, e.g. SI short) and Export (CSV) for the current series and values.
The Graph side has a time range picker plus Max data points and Min step. When the step does not line up with the scrape interval, the points on the chart are resampled, so they will not match the raw values in Table — that is expected, not a bug. Below the chart you also get load time, resolution and result-series count; that is where to look first when a query feels slow.
3. You do not have to write PromQL by hand
Three helpers sit around the input:
- Built-in metrics (left of the input): pick a metric by component type and category, and it drops straight into the box. How that catalogue is maintained is covered in Built-in metric views;
- The magnifier (right of the input): search metric names, see which labels they carry and what values those labels take;
- Historical records: the PromQL you have run against this source, up to 100 entries; click one to put it back in the box. It is stored in your own browser, so it does not follow you to another machine.
4. Compare several queries side by side
Add panel at the bottom stacks another complete query panel below the current one, each with its own data source and PromQL — handy for putting the same metric from two sources next to each other. With more than one panel, each gets a close icon.
It is not "add to dashboard". These panels live only on this page and disappear on refresh. To keep something, go to Build a dashboard.
Take the query somewhere
Once it works, the same PromQL has four destinations:
- An alert rule: Alerts & Notifications → Alert rules → Add, paste the source and the PromQL as they are, and put the threshold into the expression. See Metric rules;
- A panel: dashboard panels use the same query editor, see Build a dashboard;
- A new metric: if the query is expensive, precompute it — see Recording rules;
- A link for someone to glance at: switch to Graph, and the share icon at the top
right stores the current query as a temporary chart and gives you a
/chart/<id>link that opens without login. That link never expires and cannot be revoked, so do not treat it as controlled sharing — see Anonymous time-limited sharing.
Next
- Querying logs: Log explorer and index patterns
- Starting from one host instead: Object quick view
- Where metric names and labels come from: Metrics, labels and series