Recording rules
Precompute expensive expressions on a schedule and alert on the result instead.
Where this page ends: a recording rule evaluating on a fixed schedule, turning a PromQL expression that takes seconds to run into a new metric. Alert rules and panels then query that metric instead, and evaluation drops from seconds to milliseconds.
When it is worth it
Three cases:
- one expensive query is reused by several alert rules and several panels;
- a single evaluation already takes seconds (multi-dimension joins, high-cardinality
sum,histogram_quantile); - the query carries a long range (
[1h],[1d]) and alerting recomputes it every 30 seconds.
If the query is already fast and used in exactly one place, a recording rule only adds something else to maintain.
Before you start: the data source must accept writes
This is the step people get stuck on. After evaluating, the result is written back into the data source that was queried, through the Remote Write URL configured on that source. Leave the field empty and the rule still runs, but the result has nowhere to land.
Go to Integrations → Data sources, edit the Prometheus source you plan to use, and fill in Remote Write URL under Other (the form lists the shape for each product):
Prometheus                        http://localhost:9090/api/v1/write
Thanos                            http://localhost:19192/
VictoriaMetrics single-node       http://localhost:8428/api/v1/write
VictoriaMetrics cluster           http://{vminsert}:8480/insert/0/prometheus/api/v1/write
Prometheus itself needs --web.enable-remote-write-receiver before it accepts remote write.
The auto-registered embedded-tsdb source does not have this field set, so fill it in:
http://127.0.0.1:17000/prometheus/api/v1/write
The embedded TSDB's /prometheus endpoint only accepts requests from the local machine by
default, and recording rules run inside the Center process, so 127.0.0.1 is enough.
1. Create the rule
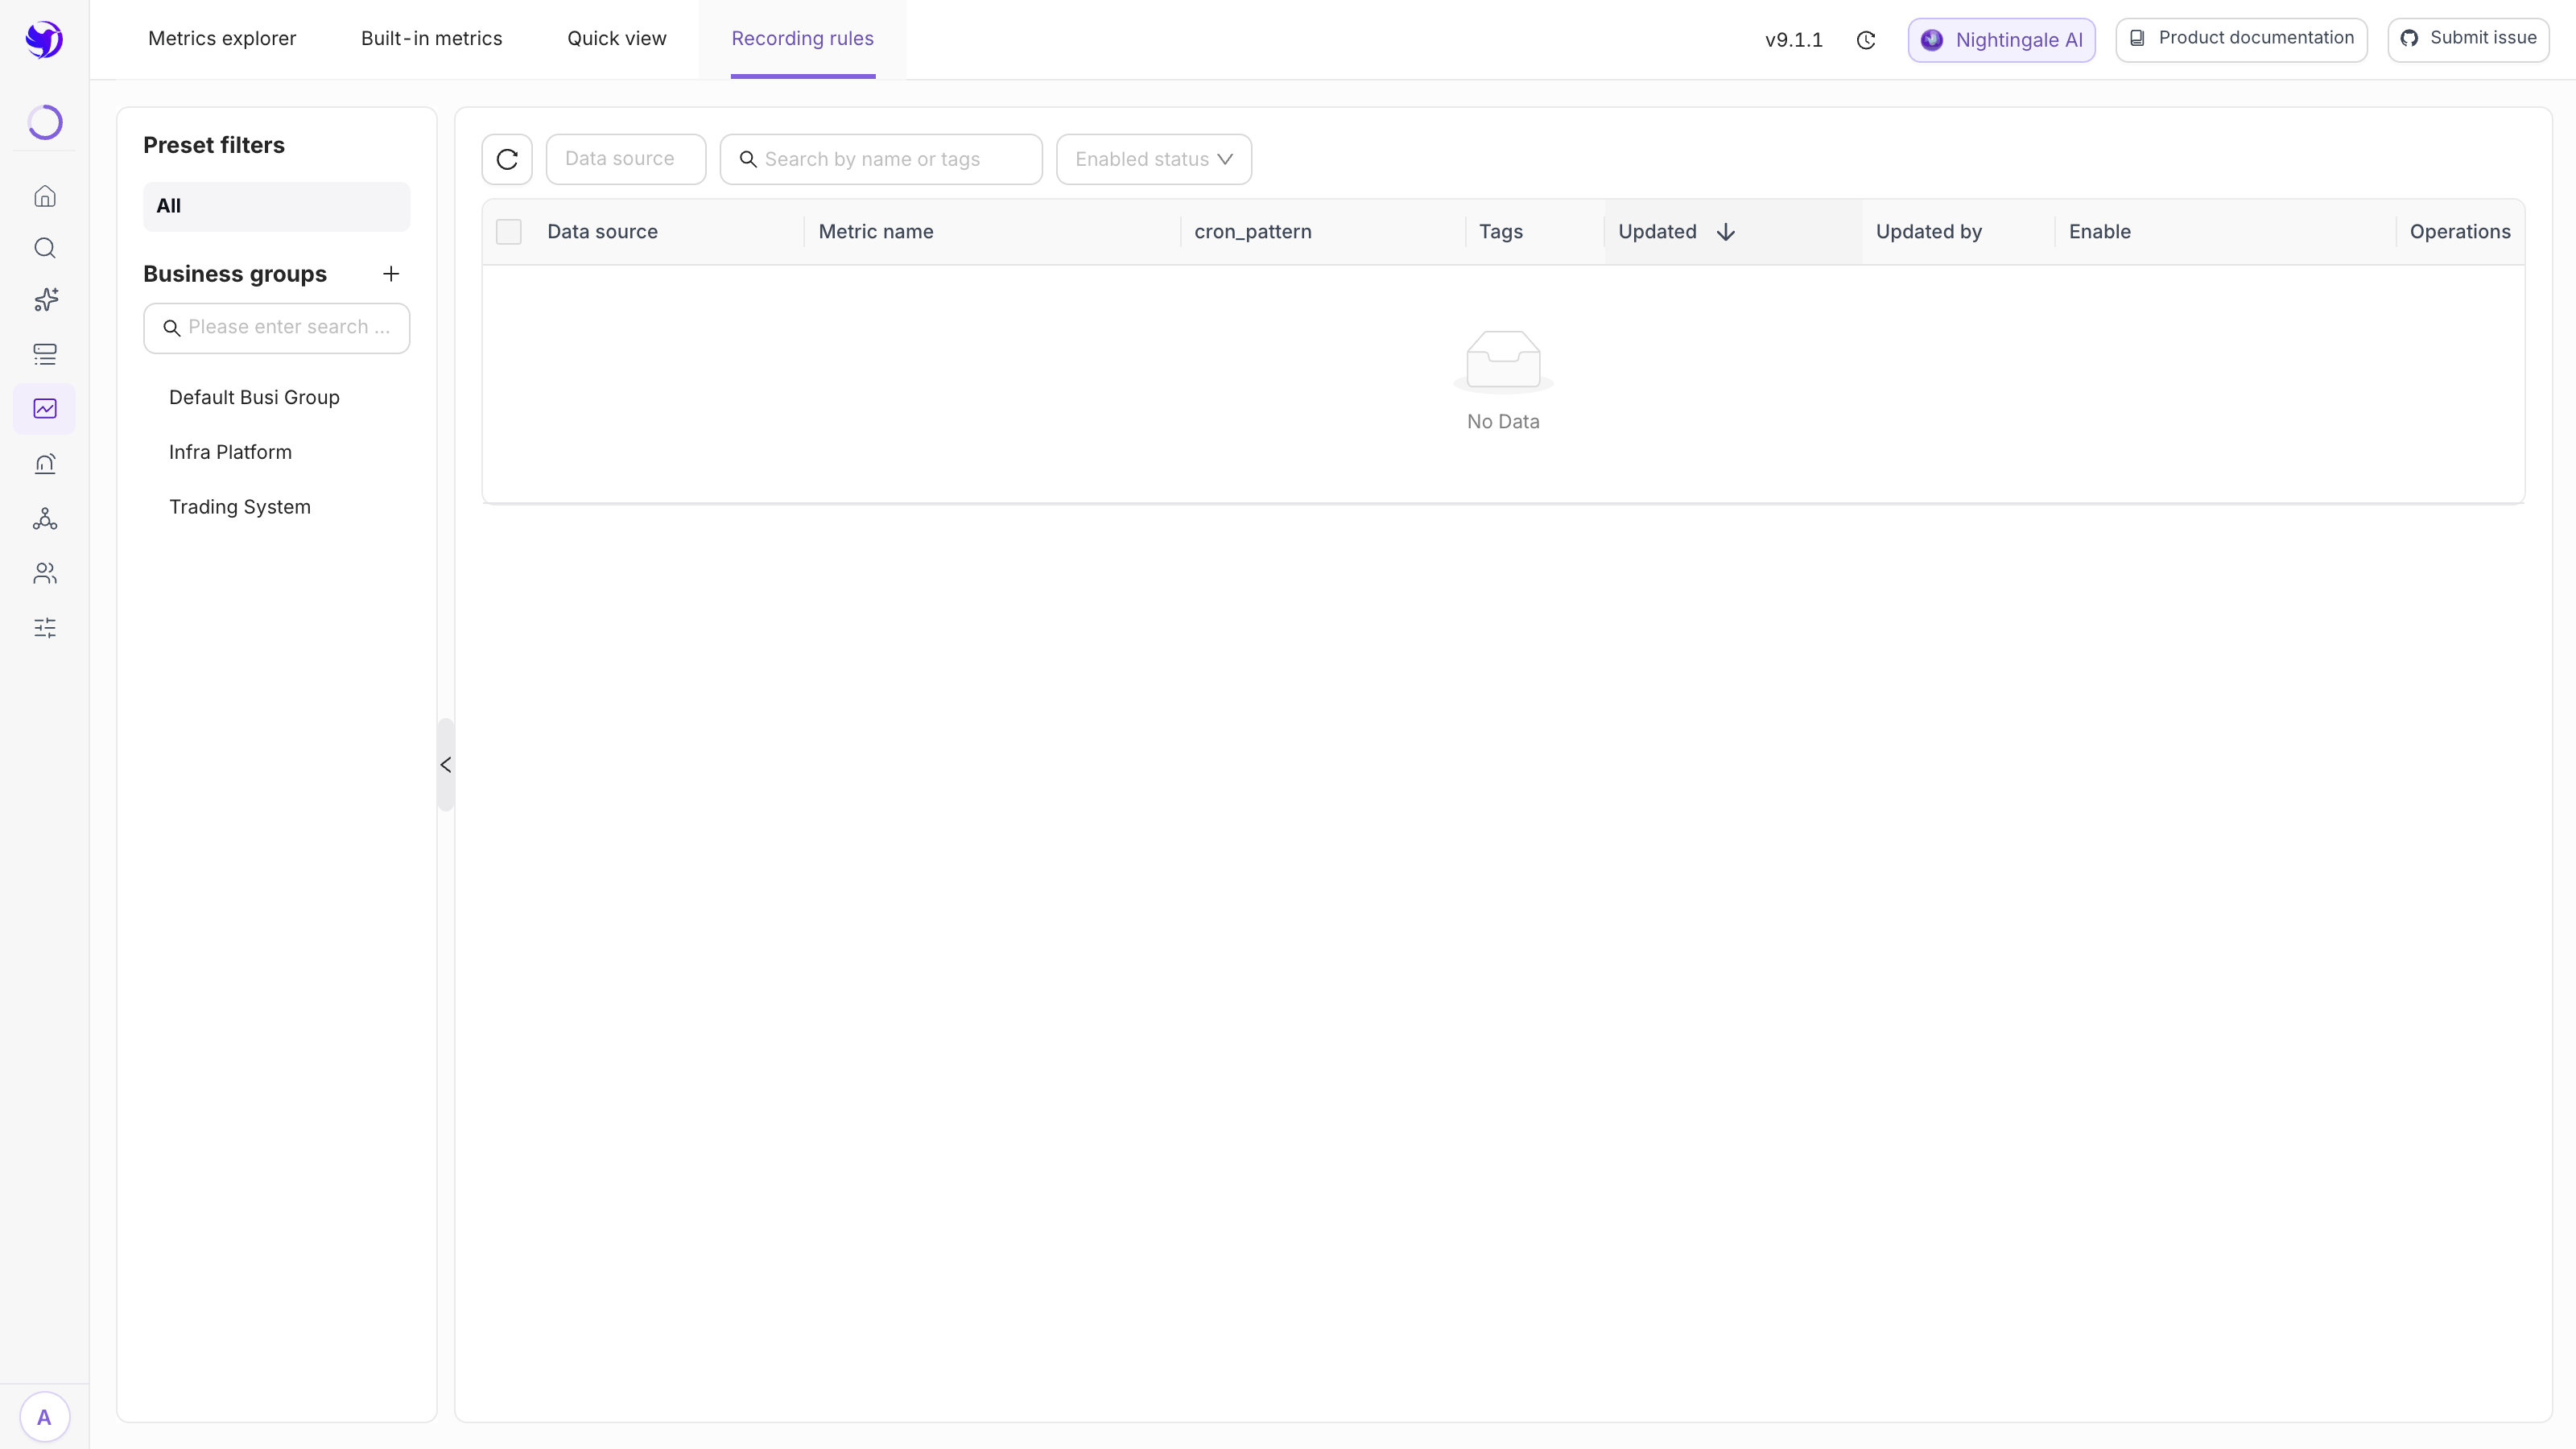
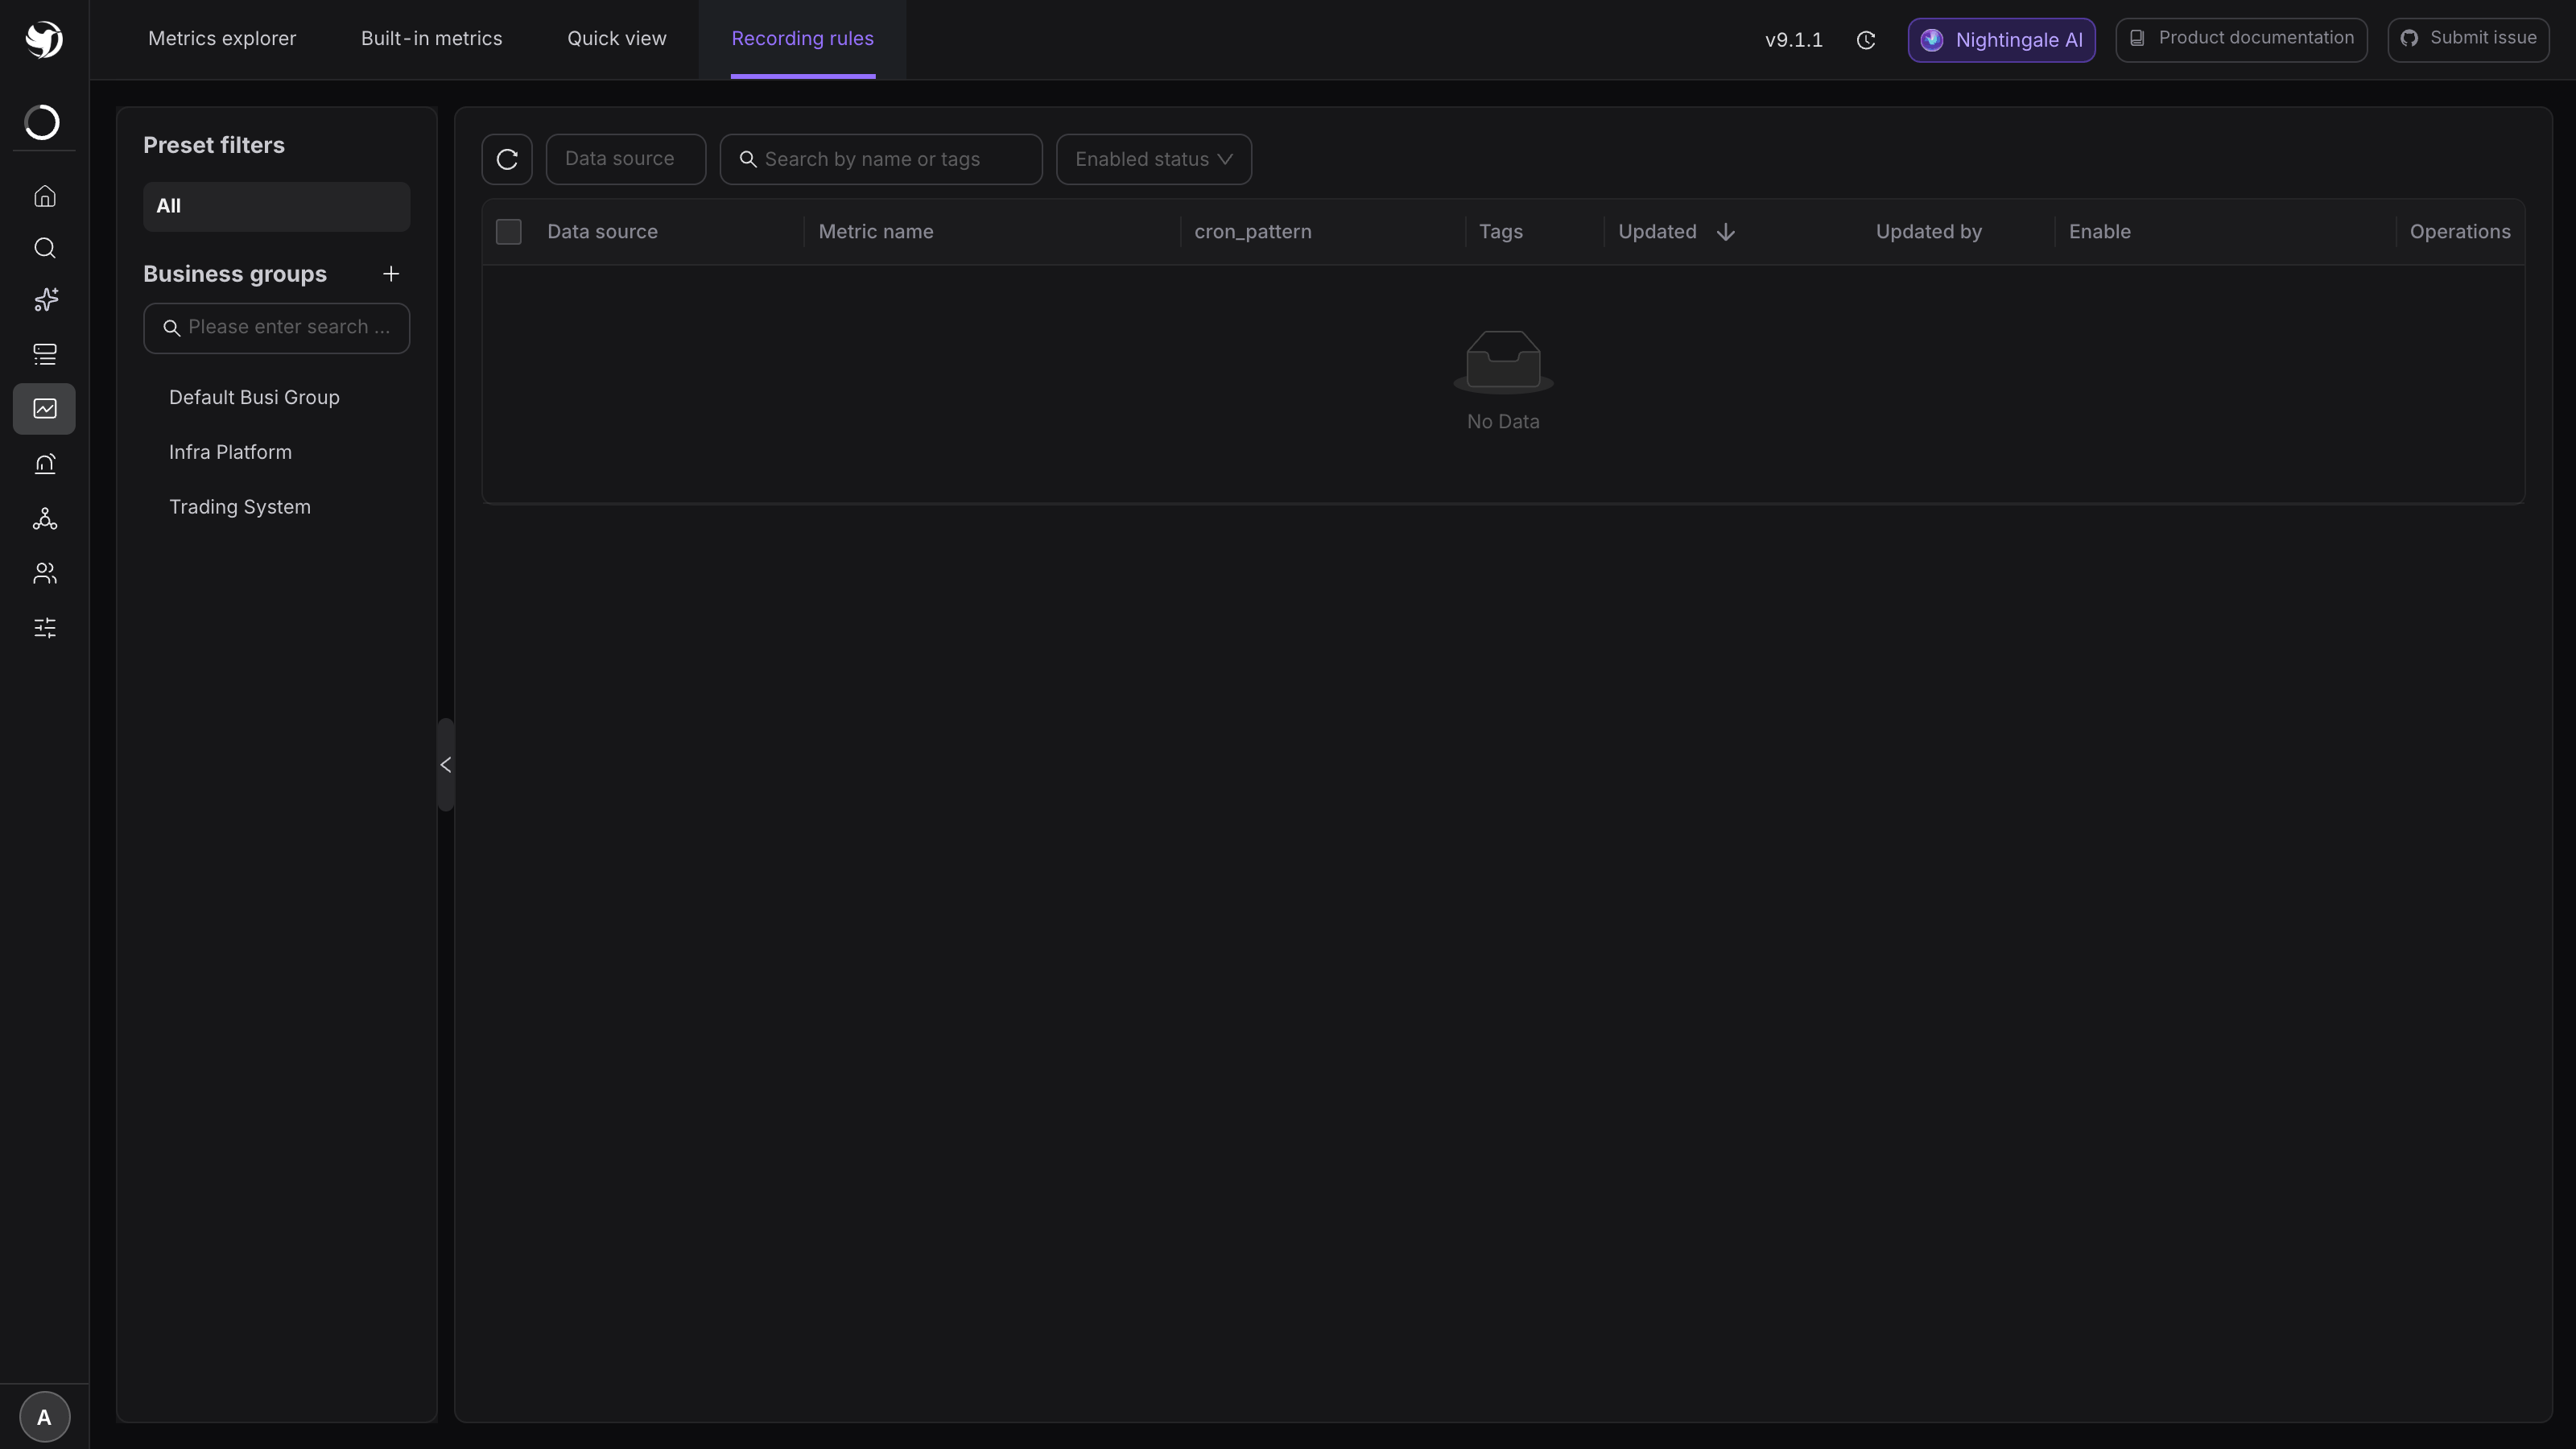
Explorer → Metrics → Recording rules (/recording-rules), then Add.
| Field | What to put in it |
|---|---|
| Business group | Which group owns the rule, and therefore who can edit it |
| Metric name | The new metric this produces. Follow the Prometheus convention <level>:<metric>:<operations> |
| Note | One line saying who this is for |
| Data source | Prometheus-type only, multi-select. Each selected source runs its own copy and writes back through its own Remote Write URL |
| PromQL | The expression to precompute, without a threshold. Each run is an instant query, so the expression must return an instant vector |
| Execution frequency | A cron expression with second precision, @every 15s by default; the dropdown offers 15s to 300s |
| Tags | key=value, separated by Enter or Space, written onto the new metric as labels |
A typical rule looks like this:
Metric name            service:http_latency:p99_5m
PromQL                 histogram_quantile(0.99, sum by (service, le) (rate(http_duration_seconds_bucket[5m])))
Execution frequency    @every 30s
Save. Expected result: the rule appears in the list with Enable switched on.
2. Confirm the new metric is actually being written
Wait one or two evaluation cycles, then go to Explorer → Metrics, pick the same data source, and query the new metric name:
service:http_latency:p99_5m
Data points mean it works. If nothing comes back, check in this order:
- is Enable on for this rule in the list;
- is Remote Write URL filled in on the data source (the section above);
- paste the PromQL into the Metrics explorer and run it — if the source expression returns nothing, the recording rule has nothing to write;
- look for
record_eval:lines in the n9e log; a failed query logsquery error, a failed write logswrite error.
3. Point the alert rule at the new metric
The rule used to query:
histogram_quantile(0.99, sum by (service, le) (rate(http_duration_seconds_bucket[5m]))) > 1
Change it to:
service:http_latency:p99_5m > 1
The threshold is unchanged; the cost per evaluation goes from recomputing a quantile to reading one lightweight metric.
Only useful if it reduces cardinality
The whole gain comes from the output being much smaller than the input. Done wrong, a recording rule is slower overall — it trades "slow query" for "slow write plus slightly faster query".
- use
sum by (<subset of labels>)to collapse down to the labels you actually alert on; - drop churning labels such as
instanceandpod, unless alerting really groups by them; - the output should have one to two orders of magnitude fewer series than the input;
- do not evaluate more often than the source metric is collected — with a 15s scrape interval, running every 5s just re-reads the same points.
What it does not do
- No backfill. The new metric starts at the moment the rule is enabled; earlier time ranges simply do not have it. To look at history you go back to the original expression.
- One PromQL per rule. The form has a single PromQL box — no multi-query composition, no cross-source arithmetic, no separate write target.
- No writing elsewhere. The result always goes back to the source that was queried, and that source's own Remote Write URL decides where it lands.
Next
- Alert on the new metric: Metric rules
- Chart it: Build a dashboard
- Find out where the time actually goes: Slow queries and evaluation