Object quick view
From a host in the target list to its key metrics in one click.
Where this page ends: metrics for a few selected hosts without having to work out the query first, and "the hosts and metrics I check every morning" saved as a view you just reopen.
Two routes, pick one
| What you want | Route |
|---|---|
| Look at a few hosts once and move on | Tick rows on the host list, click the icon in the toolbar |
| Look at the same hosts and the same metrics daily | Quick view — configure it once and save it |
Both read the same built-in metric catalogue; they differ in where you enter and whether the selection is saved.
1. One click from the host list
Infrastructure → Hosts (/targets), tick one or more hosts. The last button in the
toolbar is icon-only; hovering it shows "View monitoring metrics of selected hosts". It stays
disabled until at least one row is ticked.
It opens a full-width drawer titled Built-in metrics: the catalogue on the left, already filtered to the hosts you ticked, and a chart on the right when you click a metric.
Expected result: tick n9e-web-01, click cpu_usage_idle, and you get that host's line —
not every host in the environment.
It does not navigate and has no URL of its own; closing the drawer returns you to the host list. So it is for a look, not for keeping. To keep it, see the next section.
2. Quick view: save the set you keep coming back to
Explorer → Metrics → Quick view (/object/explorer).
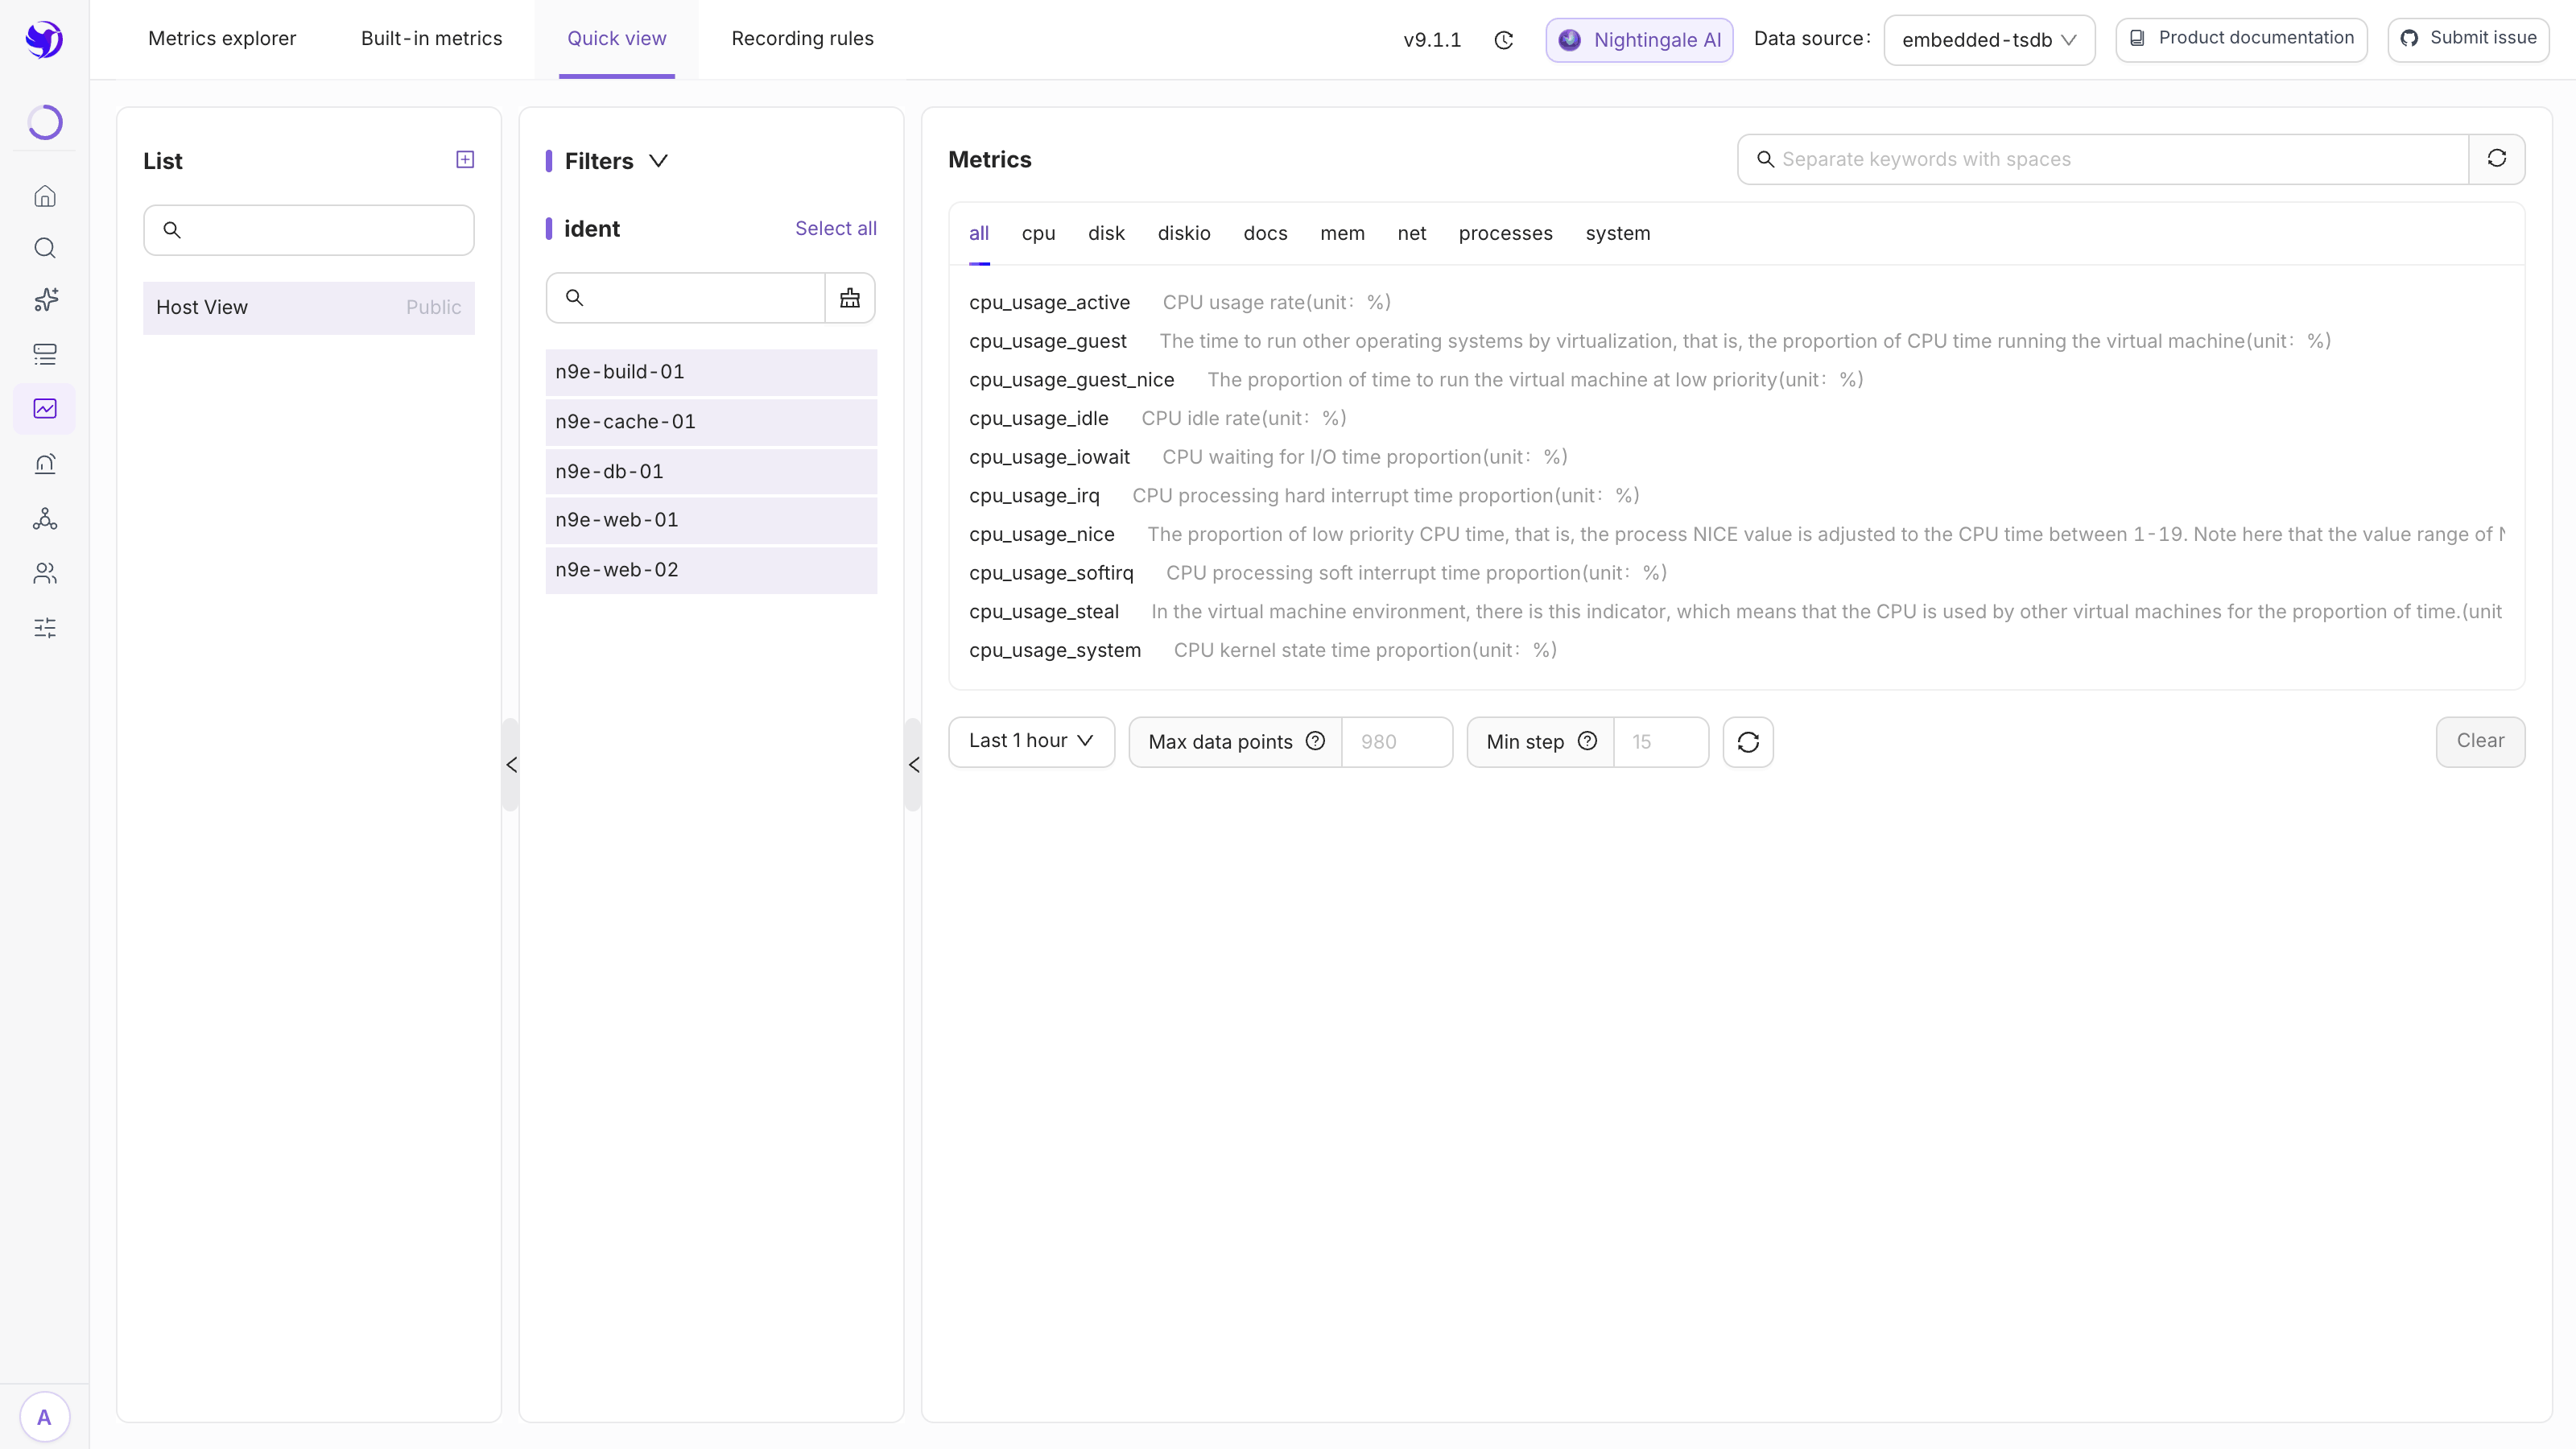
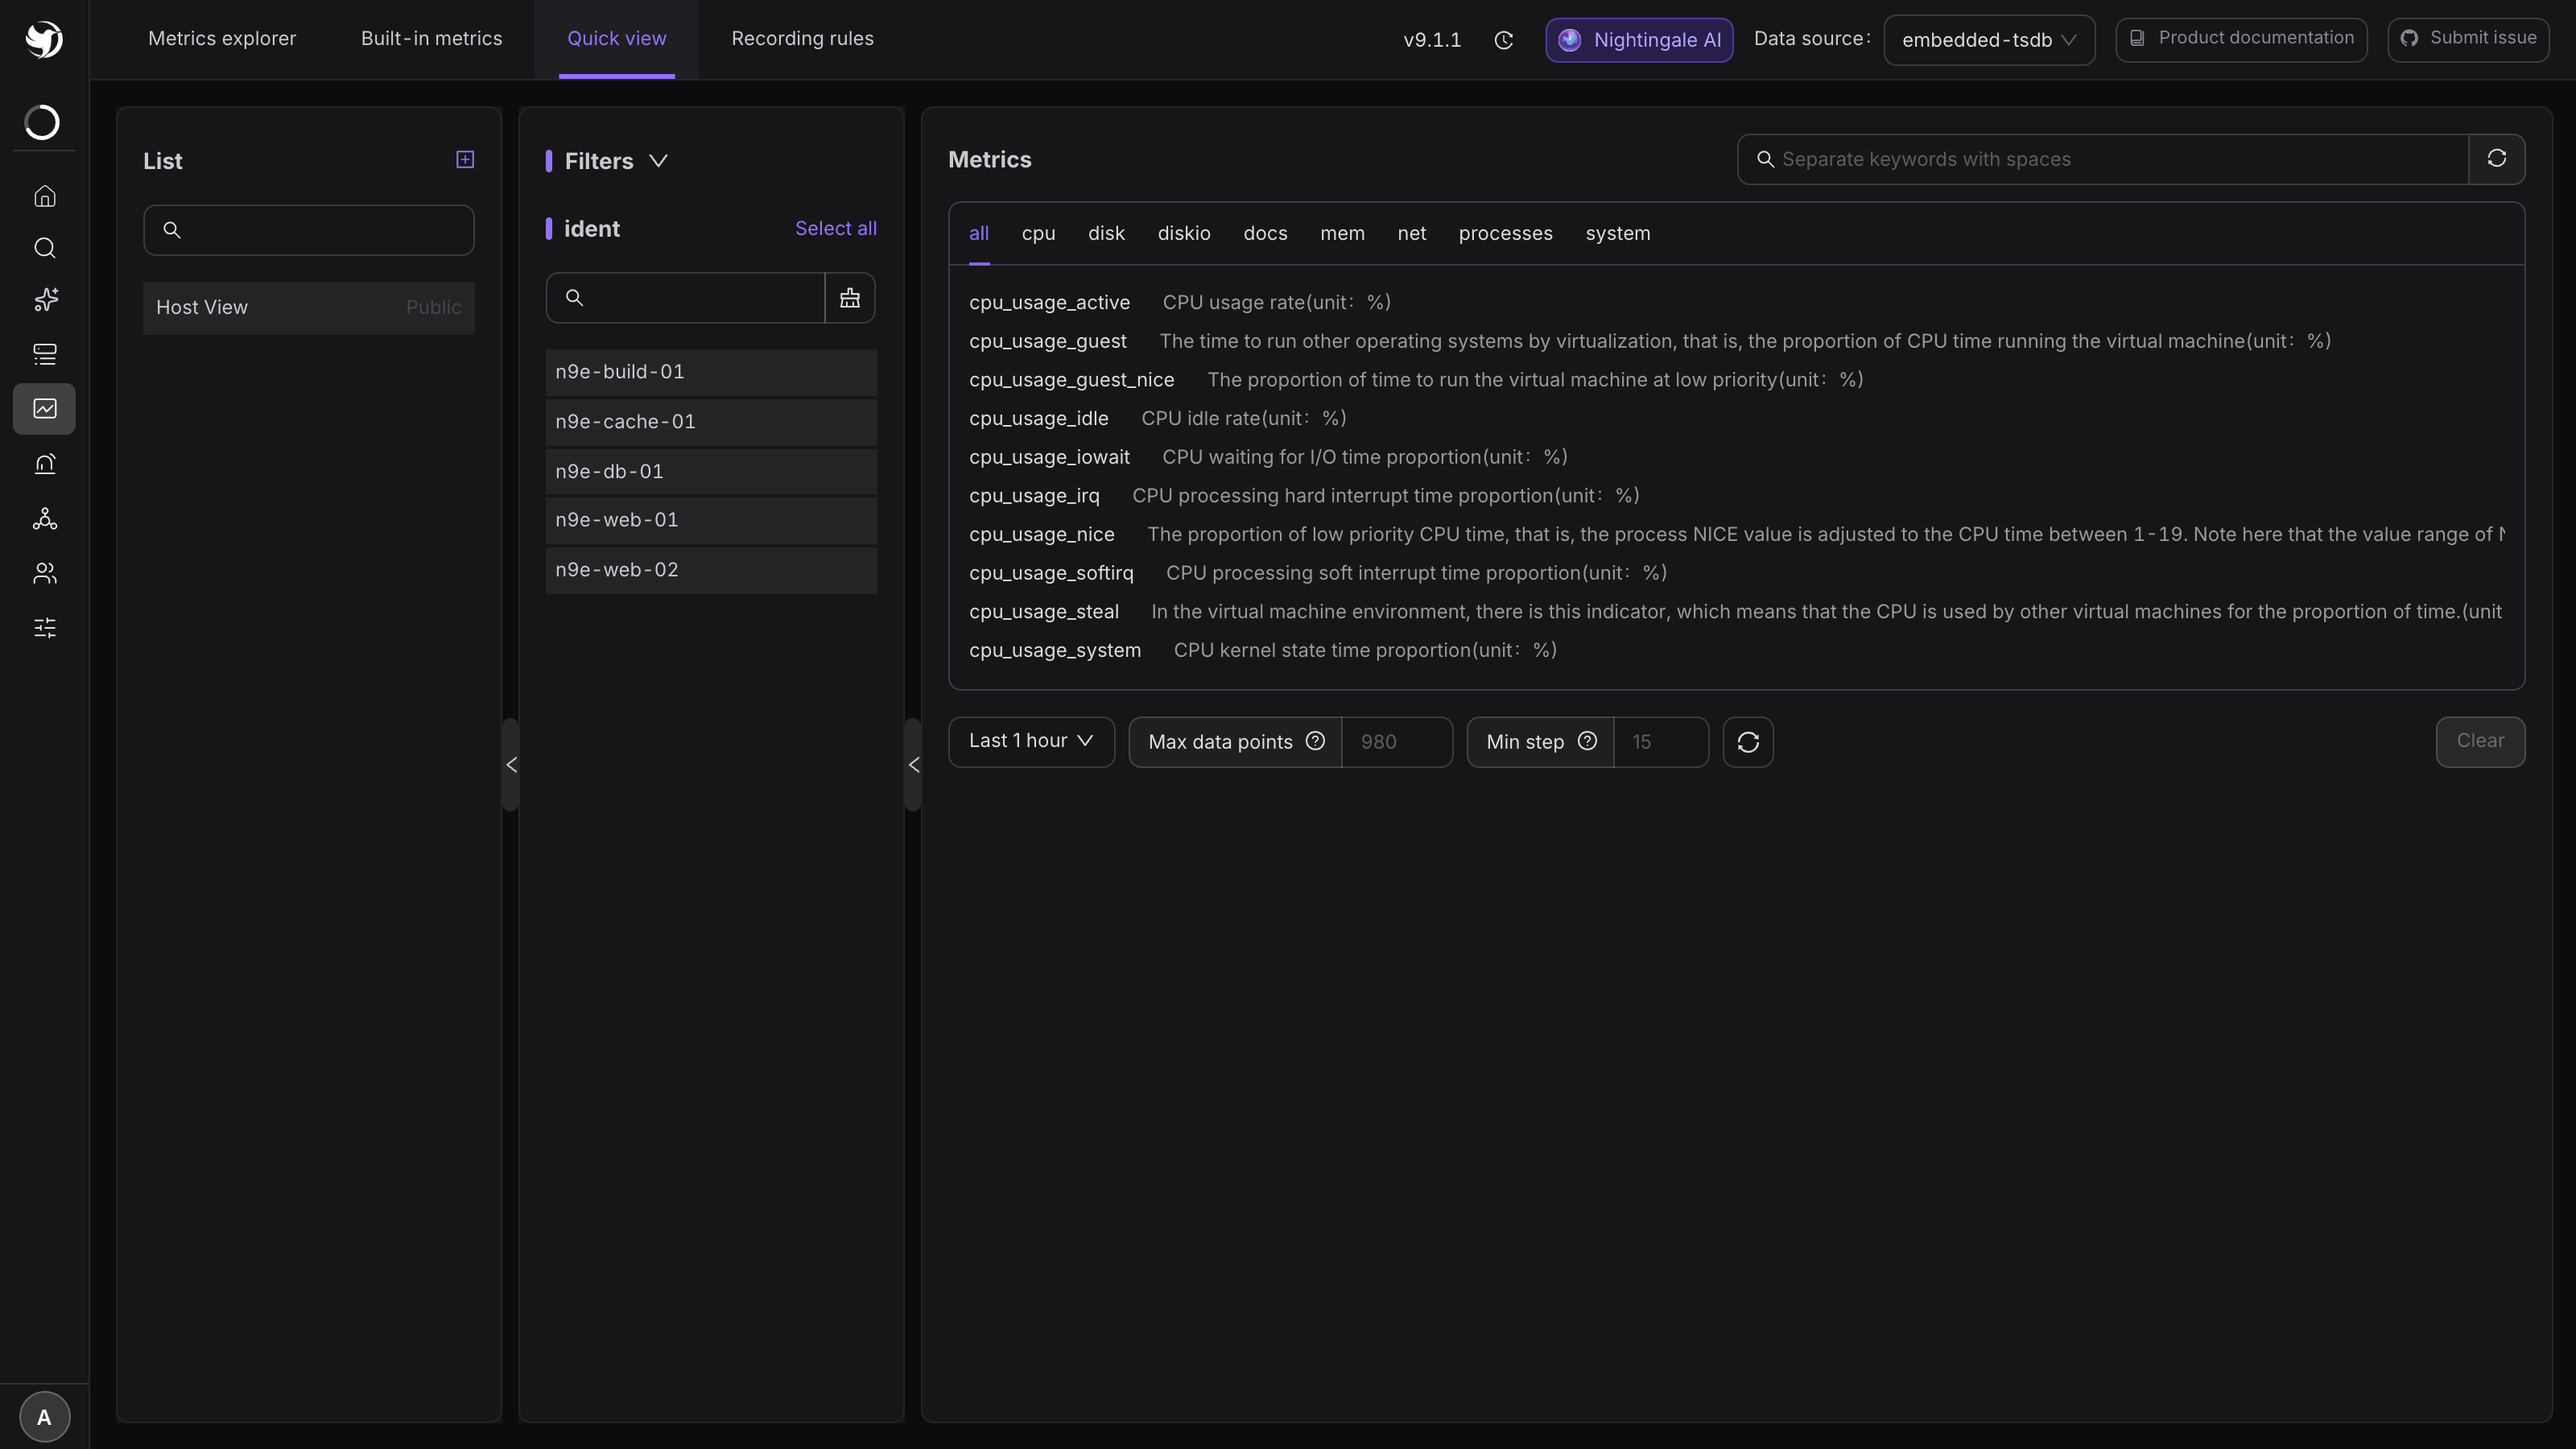
Pick a data source at the top right first. Without one, all three columns are empty — which is the most common reason the page "looks blank", and it is not a data problem.
Each column does one job:
| Column | What it does |
|---|---|
| List | The existing views. + at the top right creates one; a view marked Public is usable by others |
| Filters | Lists every value of the dimension the view defines (ident in the screenshot); tick a few to look at only those. Select all and Clear sit at the top right |
| Metrics | Categories across the top, derived from the metric-name prefix (all / cpu / disk / mem / net / processes / system…); click a metric name to chart it below |
Below the chart area: the time range, Max data points, Min step and Clear. Charts also accept a function, an offset comparison, an aggregation and its grouping labels.
3. Create your own quick view
Click + at the top of the List column:
| Field | What to put in it |
|---|---|
| Name | |
| Public | Turn on to let others use this view |
| Filters | Fixed label conditions, e.g. keeping only one set of hosts |
| Dynamic labels | Labels that can be chosen on the page itself |
| Dimension labels | Required. The middle column lists the values of this label; for hosts, use ident |
| Ignore metric prefix | The categories on the right come from the metric-name prefix. Setting monitor_ files monitor_cpu_usage under cpu |
Preview before saving; if the preview shows no values, fix the filters rather than saving. The list also exports a view's config JSON and imports one back.
What it stores, and what it does not
- It stores filters and dimensions, not a fixed set of charts. Everything is picked and drawn on the spot, which is also why it is not a wall display;
- It only accepts Prometheus-type data sources;
- For a fixed layout, for sharing outside, or for embedding elsewhere, use a dashboard — see Build a dashboard.
Next
- Maintaining what is in the catalogue: Built-in metric views
- How hosts get into the list: Targets and heartbeat
- Charts you want to keep: Build a dashboard