Log explorer and index patterns
Search ElasticSearch, Loki and VictoriaLogs sources, define index patterns, and pivot from a log line to a rule.
Where this page ends: one search running against your log store, narrowed to the lines you care about using the field sidebar, and "which indices, which time field" saved as an index pattern so you never type it again.
Before you start: which sources this page accepts
The open-source Log explorer supports three categories only: Elasticsearch, Loki and VictoriaLogs.
OpenSearch, ClickHouse and Doris can be registered as data sources, but cannot be selected on this page. With none available, the page says "No available data source type" and points at data source management.
Registering the source itself is covered in ElasticSearch / OpenSearch and Loki / VictoriaLogs.
1. Pick a source and run the first search
Explorer → Logs (/log/explorer).
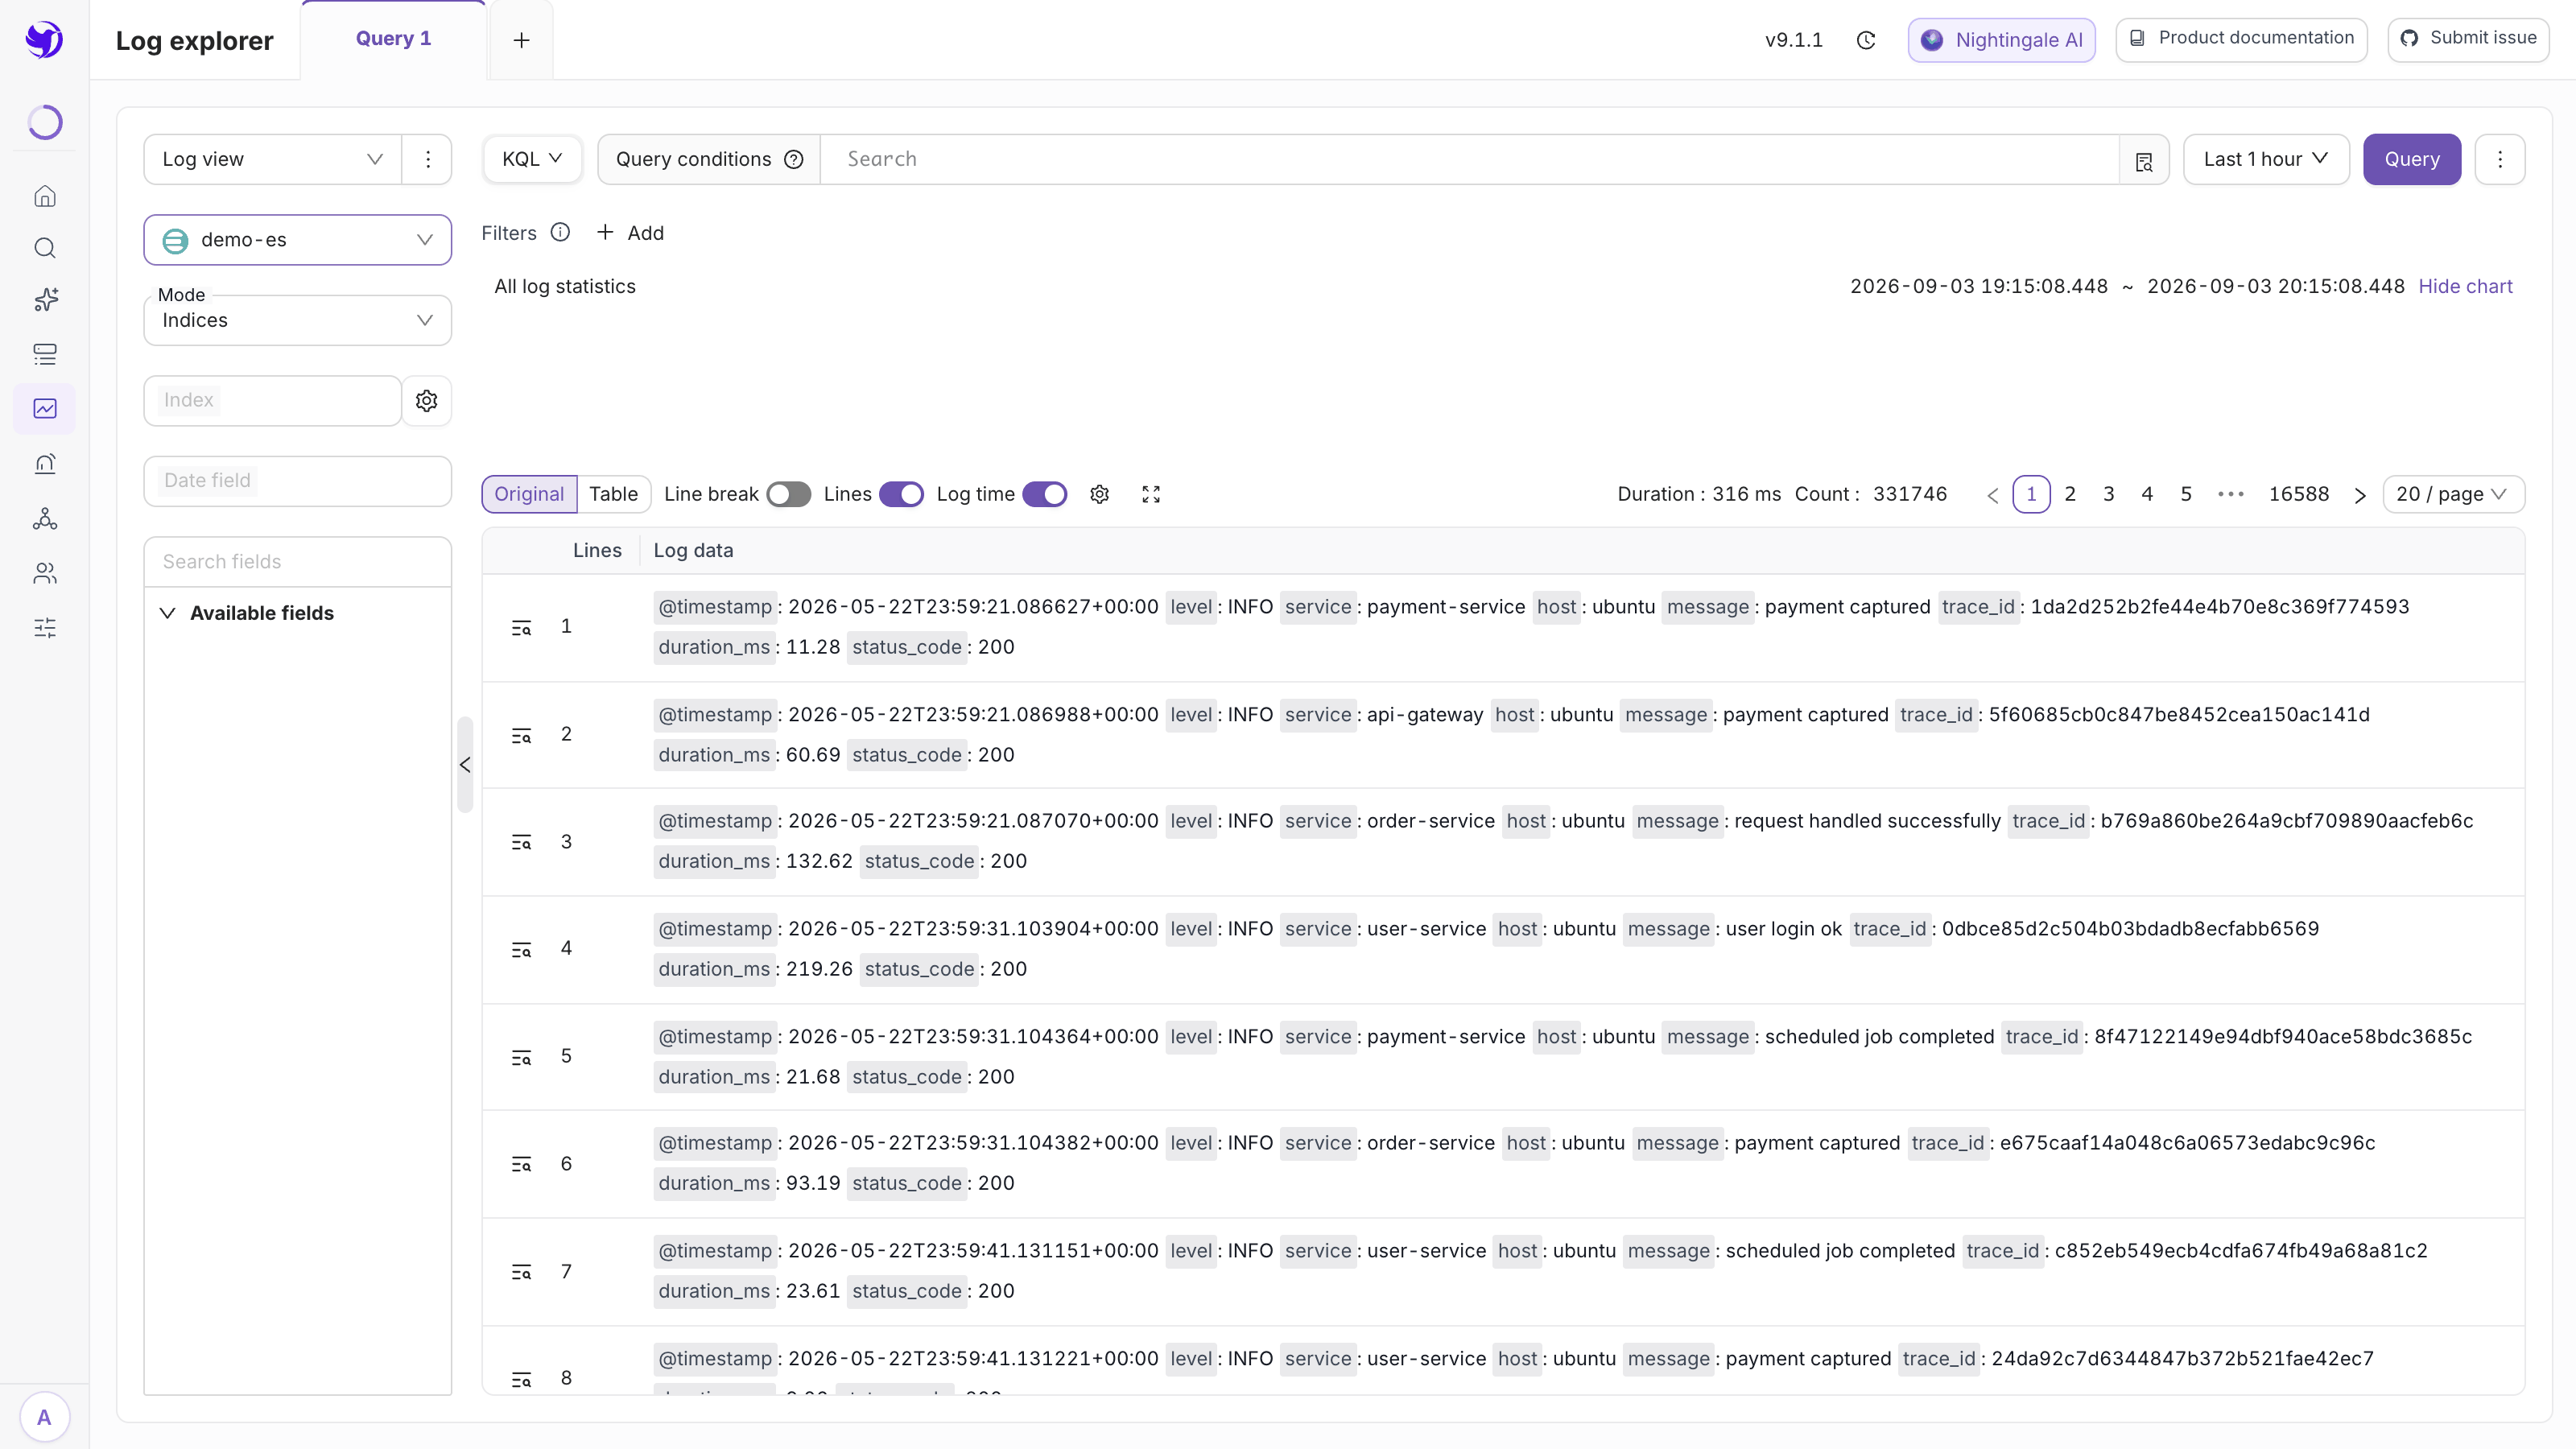
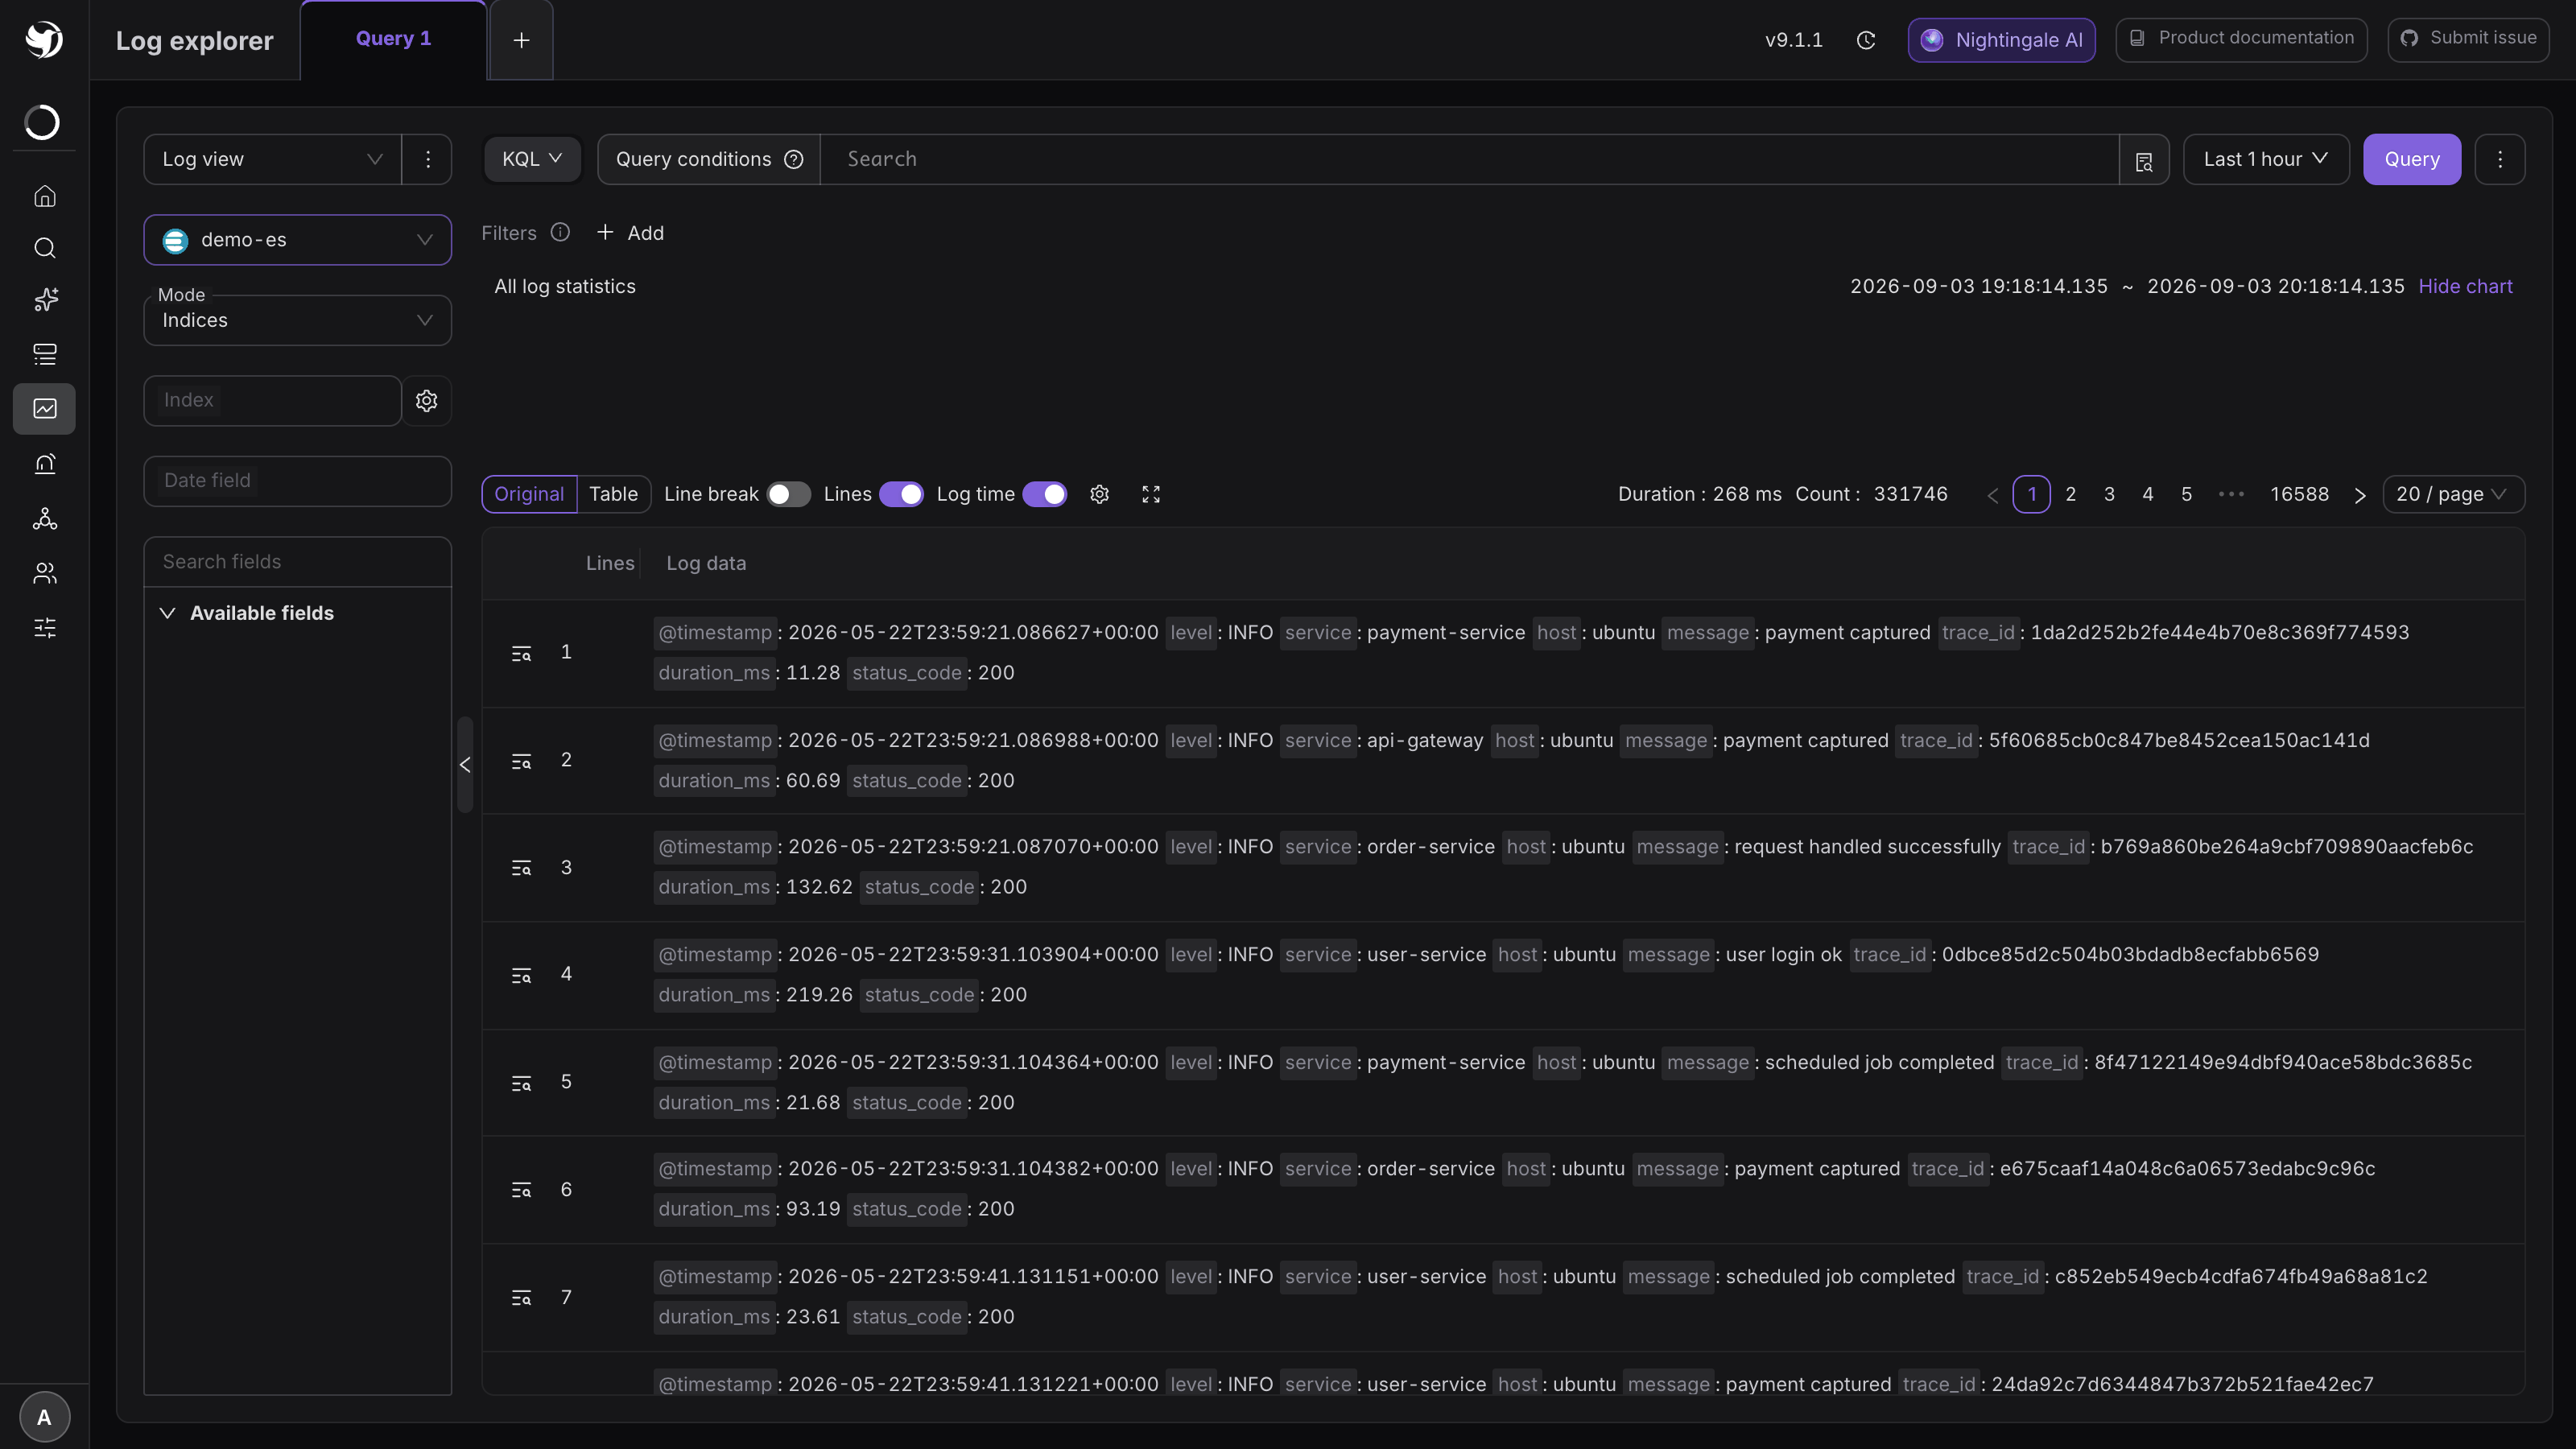
The left column, top to bottom (this is the Elasticsearch shape):
| Control | What to put in it |
|---|---|
| Data source | One of the three categories above |
| Mode | Indices (type the index directly) or Index patterns (use a saved pattern) |
| Index | An index name or wildcard such as app-log-*. The gear beside it manages index patterns |
| Date field | Which field is the time axis, usually @timestamp |
The top row holds the syntax switch (KQL / Lucene), Query conditions, the time range (last 1 hour by default) and Query. Click Query.
Expected result: a histogram appears in the middle, the log table below it, and the duration and match count at the top right.
The two syntaxes:
Lucene    status:active                  field equals
          title:(quick OR brown)         field contains either term
          author:"John Smith"            exact phrase
          bro*                           wildcard; ? matches one character
          quikc~                         fuzzy
          count:[1 TO 5]  age:>10        ranges
          quick AND brown  NOT fox       boolean

KQL       method: GET
          level: error*
          response_time >= 1 and response_time <= 5
          method: POST and status_code: (500 or 502)
          user:{ first: "Alice" and last: "White" }     nested fields
The row above the table: Original / Table / Time series / Clustering switch the display form; Line break, Lines and Log time toggle columns; the gear opens field column settings.
2. Narrow the results from the field sidebar
Available fields at the bottom left lists every field seen in this batch. Hover one and three actions appear:
- Add to current query — adds
field: valueas a condition; - Exclude from current query — adds the negation;
- Filter documents with this field.
Clicking a field name also shows its top N values with their share — the fastest way to answer "which service is producing most of these errors".
Filters → Add above the table builds explicit conditions as field / operator / value. Filters are combined with AND, and each one can be disabled instead of deleted, which makes trying combinations cheap.
To put a colleague in front of the same screen, use ⋮ → Share link at the top right: it serialises the current query into the URL and copies it. That is for someone already logged in, not an anonymous link.
3. Index patterns: save "which indices" once
Typing app-log-* and @timestamp every time gets old. Save them as an index pattern.
The entry point is not in the side menu: switch Mode to Index patterns, and the
gear next to the index box opens the manager (/log/index-patterns). Click
Create index pattern:
| Field | What to put in it |
|---|---|
| Data source | Required, Elasticsearch-type only |
| Cross cluster | Turn on for cross-cluster search |
| Name | An index wildcard such as app-log-*. A * is appended automatically if you omit it |
| Time field | Picked from the date-typed fields of that index, @timestamp by default |
| Match any index, including hidden ones | Whether indices starting with . count too |
| Note |
The right half of the drawer previews which indices match, and says "No matching indexes" when none do — check the wildcard there rather than saving and wondering later.
The page is gated by the /log/index-patterns permission point; without it, the gear is not
even rendered.
How Loki and VictoriaLogs differ
Neither has the concept of an index or a date field, so those two boxes do not appear.
- Loki: the box takes LogQL, e.g.
{job="varlogs"} |= "error". A builder drawer next to it assembles labels, line filters, parsers and range aggregations step by step, with a Preview QL before you run it; a log line can also open a context viewer showing what happened around it. - VictoriaLogs: the box takes LogsQL, defaulting to
*(match everything). It adds Limit entries and Total hits, and the display forms are Group / Table / JSON.
From a log line to a rule
There is no "create alert rule" button on this page — do not go looking for it. The way to turn a working search into an alert is:
- write down four things: data source, index (or index pattern), date field, query conditions;
- go to Alerts & Notifications → Alert rules → Add and pick a log rule type;
- fill those four in as they are, then decide how many matches count as a problem.
Field semantics and picking the threshold are covered in Log rules.
Next
- Write the log rule: Log rules
- Connect an ES / OpenSearch cluster: ElasticSearch / OpenSearch
- Connect Loki / VictoriaLogs: Loki / VictoriaLogs