Loki / VictoriaLogs
Register a log store, write a LogQL or LogsQL query, and alert on counts or matches.
Where this page ends: a connected Loki or VictoriaLogs, a query that returns log lines in the Log explorer, and a rule that fires when a keyword appears more than N times in five minutes.
Both play the same role in Nightingale — a log store you search under Explorer → Logs and write log alert rules against. Only the query language and the URL shape differ.
One shared limitation up front: neither type can back a dashboard panel. They do not appear in the dashboard data source picker. To chart something, turn the count into a metric, or use a different store.
Loki: the URL must end in /loki
Integrations → Data sources → Add → Loki.
| Field | What to put in it |
|---|---|
| Name | Required |
| URL | Must carry the /loki suffix, e.g. http://loki:3100/loki. The form's placeholder is literally http://localhost:3100/loki |
| Timeout(ms) | Defaults to 10000 |
| User / Password | Fill these when an auth gateway sits in front of Loki |
| Custom HTTP headers | In multi-tenant mode, add X-Scope-OrgID here with the tenant ID as its value |
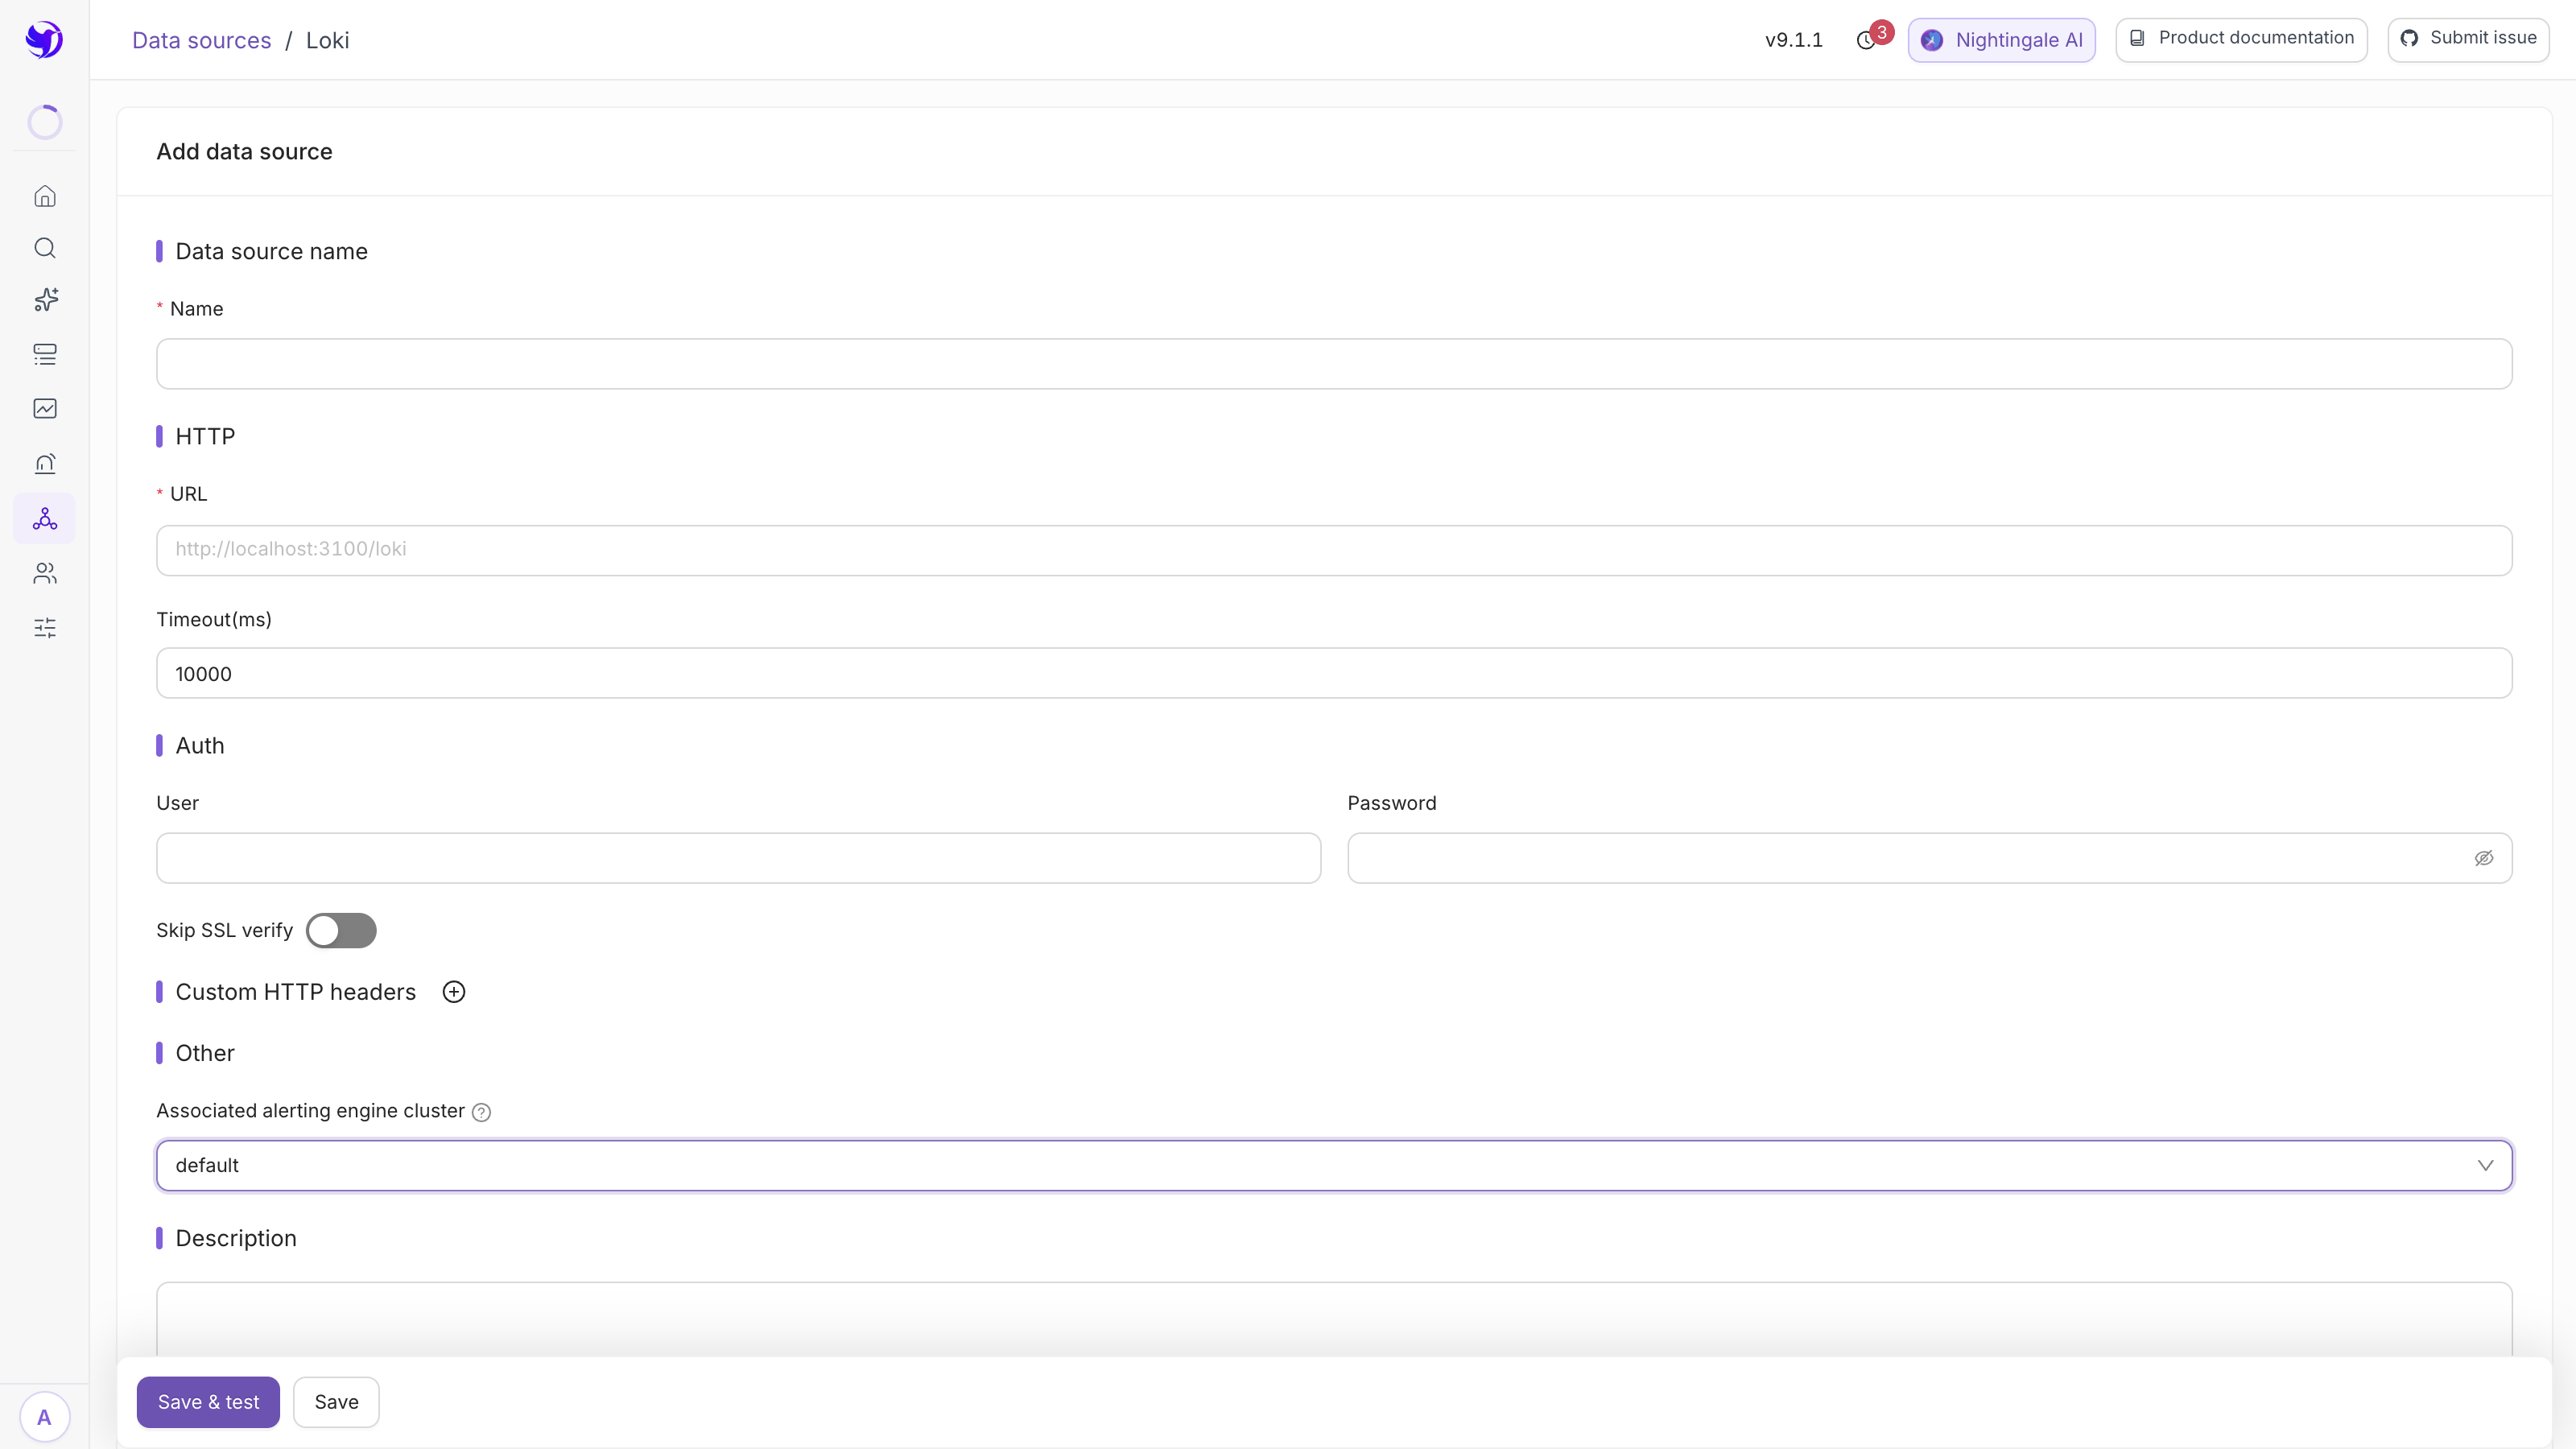
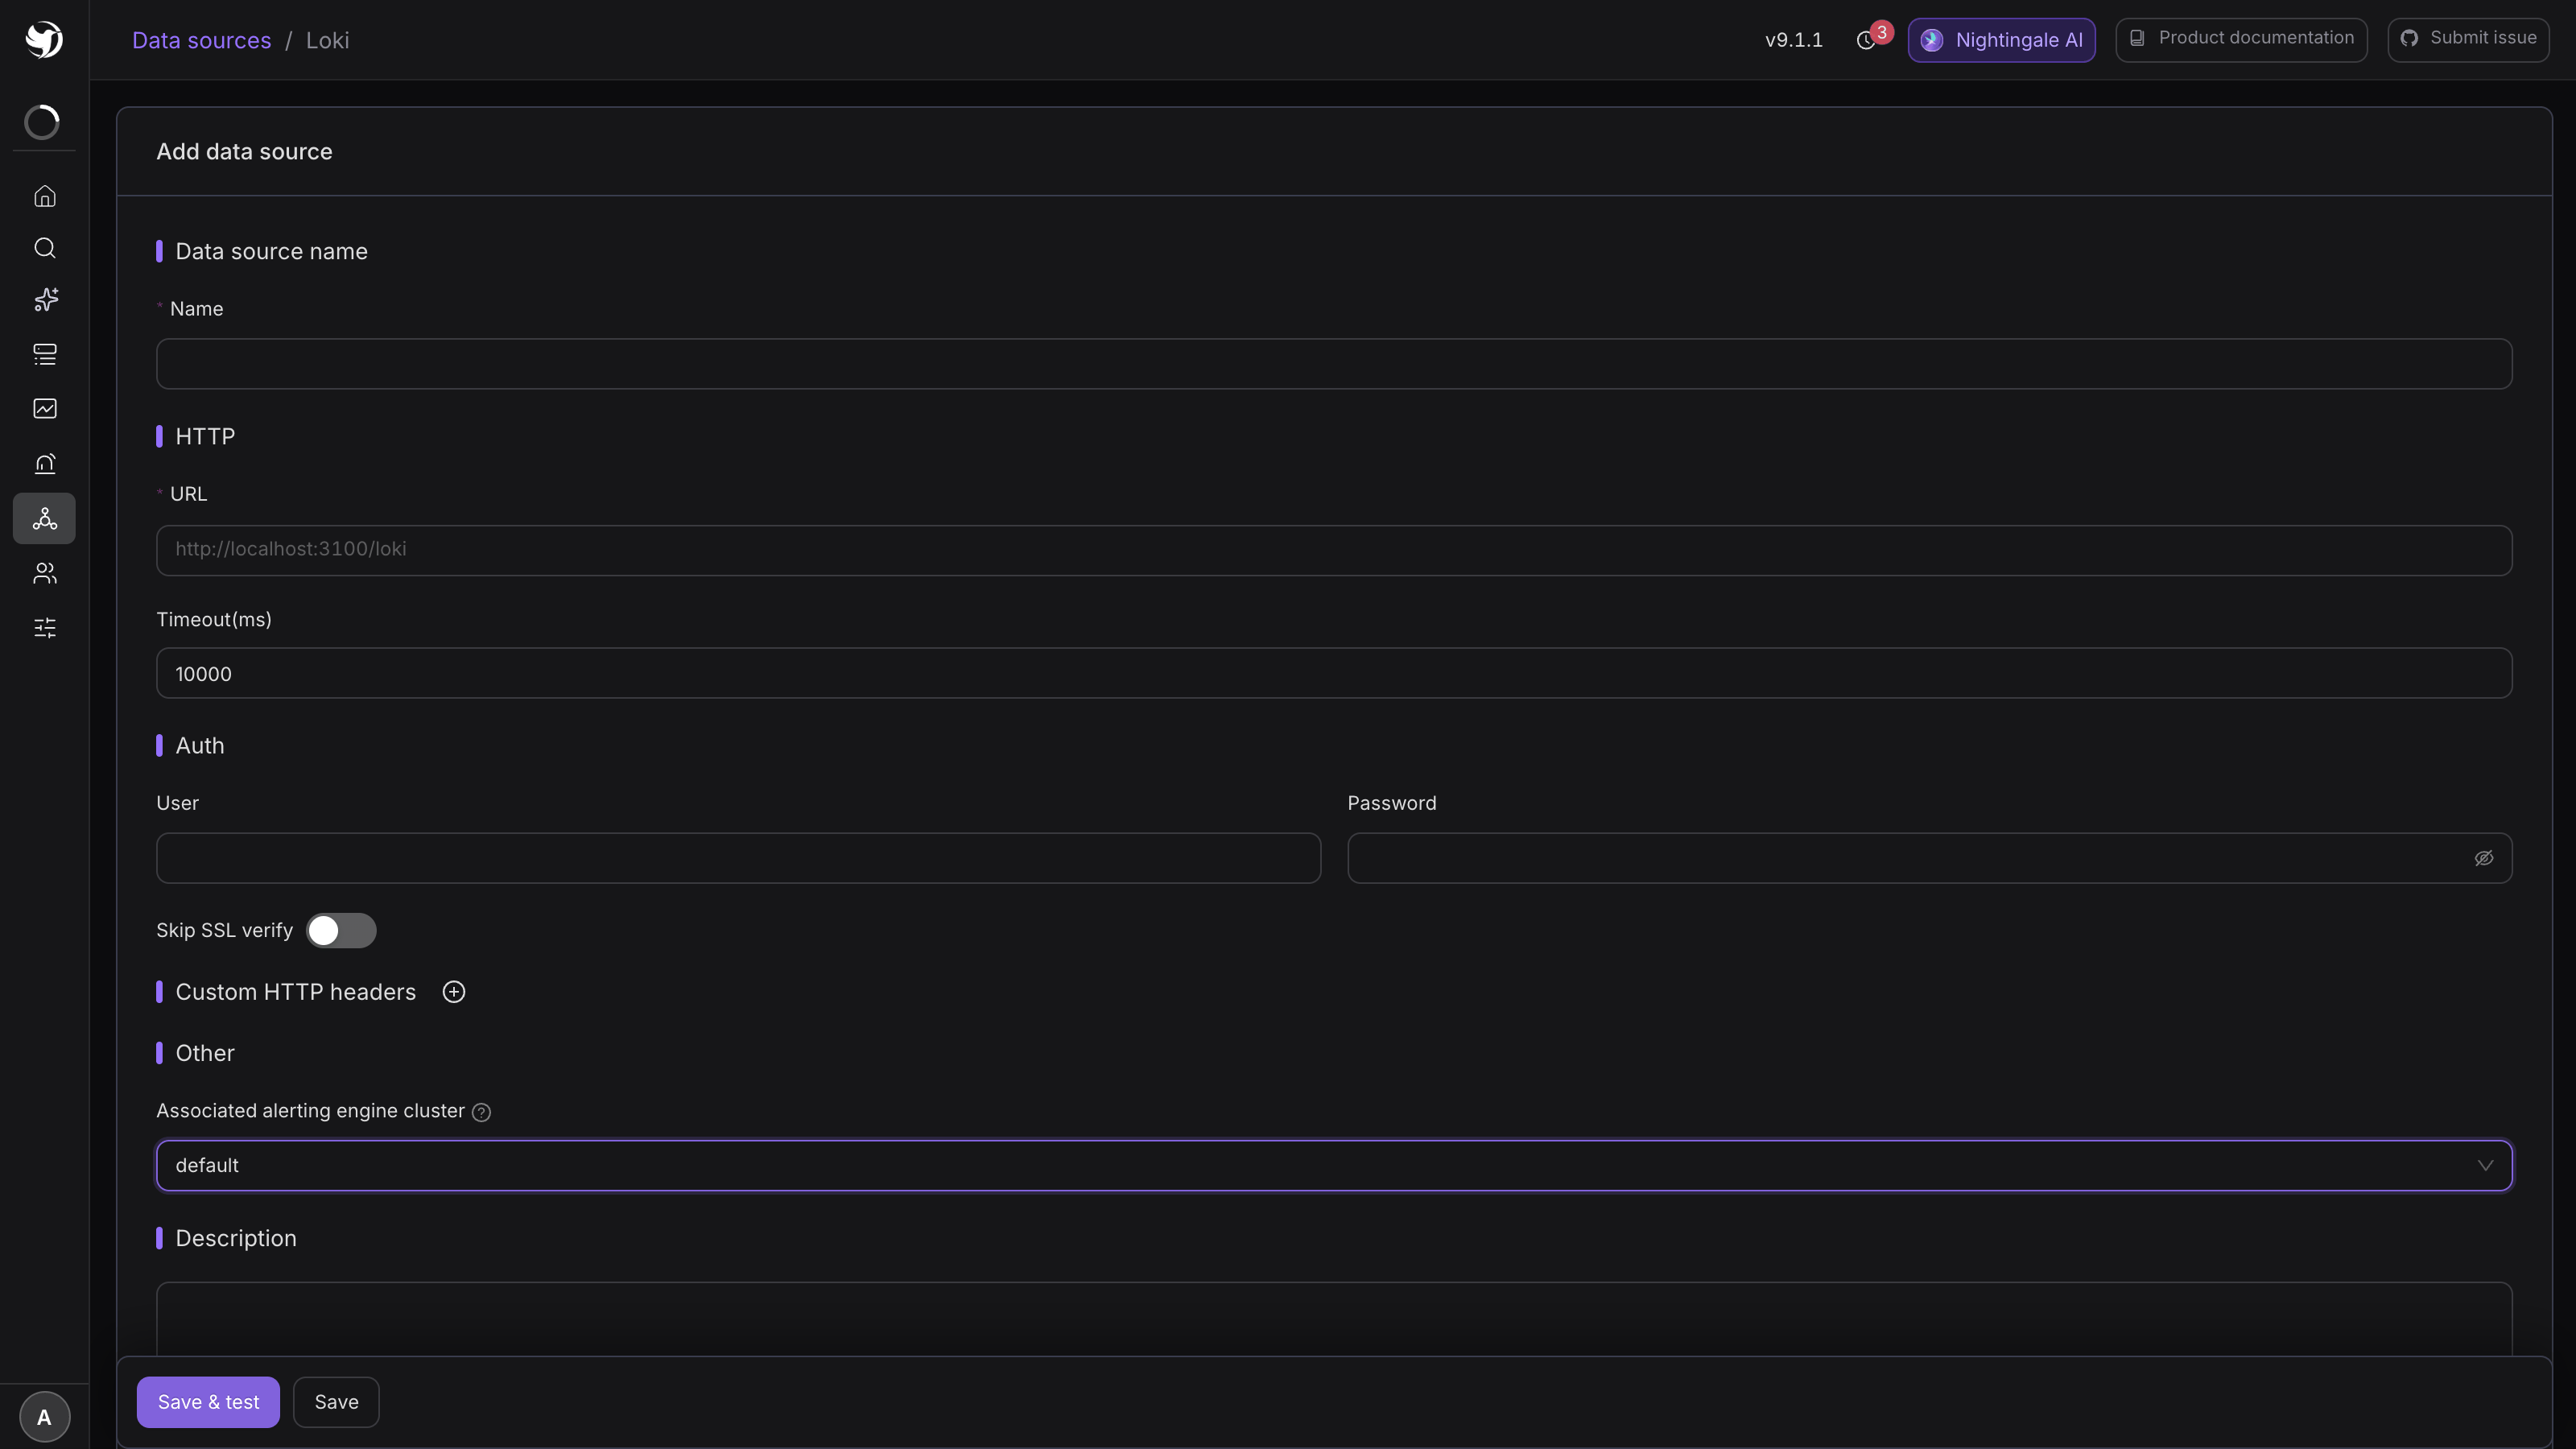
A URL missing /loki is the single most common mistake. Save & test requests
<URL>/api/v1/labels; on a 404 with no /loki in the URL, Nightingale hands you the corrected
address directly: /loki suffix is miss, please add /loki to the url: ....
To find out whether you need a tenant ID, query Loki once without the header. no org id back
means multi-tenancy is on and X-Scope-OrgID is required.
VictoriaLogs: address and row cap
Integrations → Data sources → Add → VictoriaLogs.
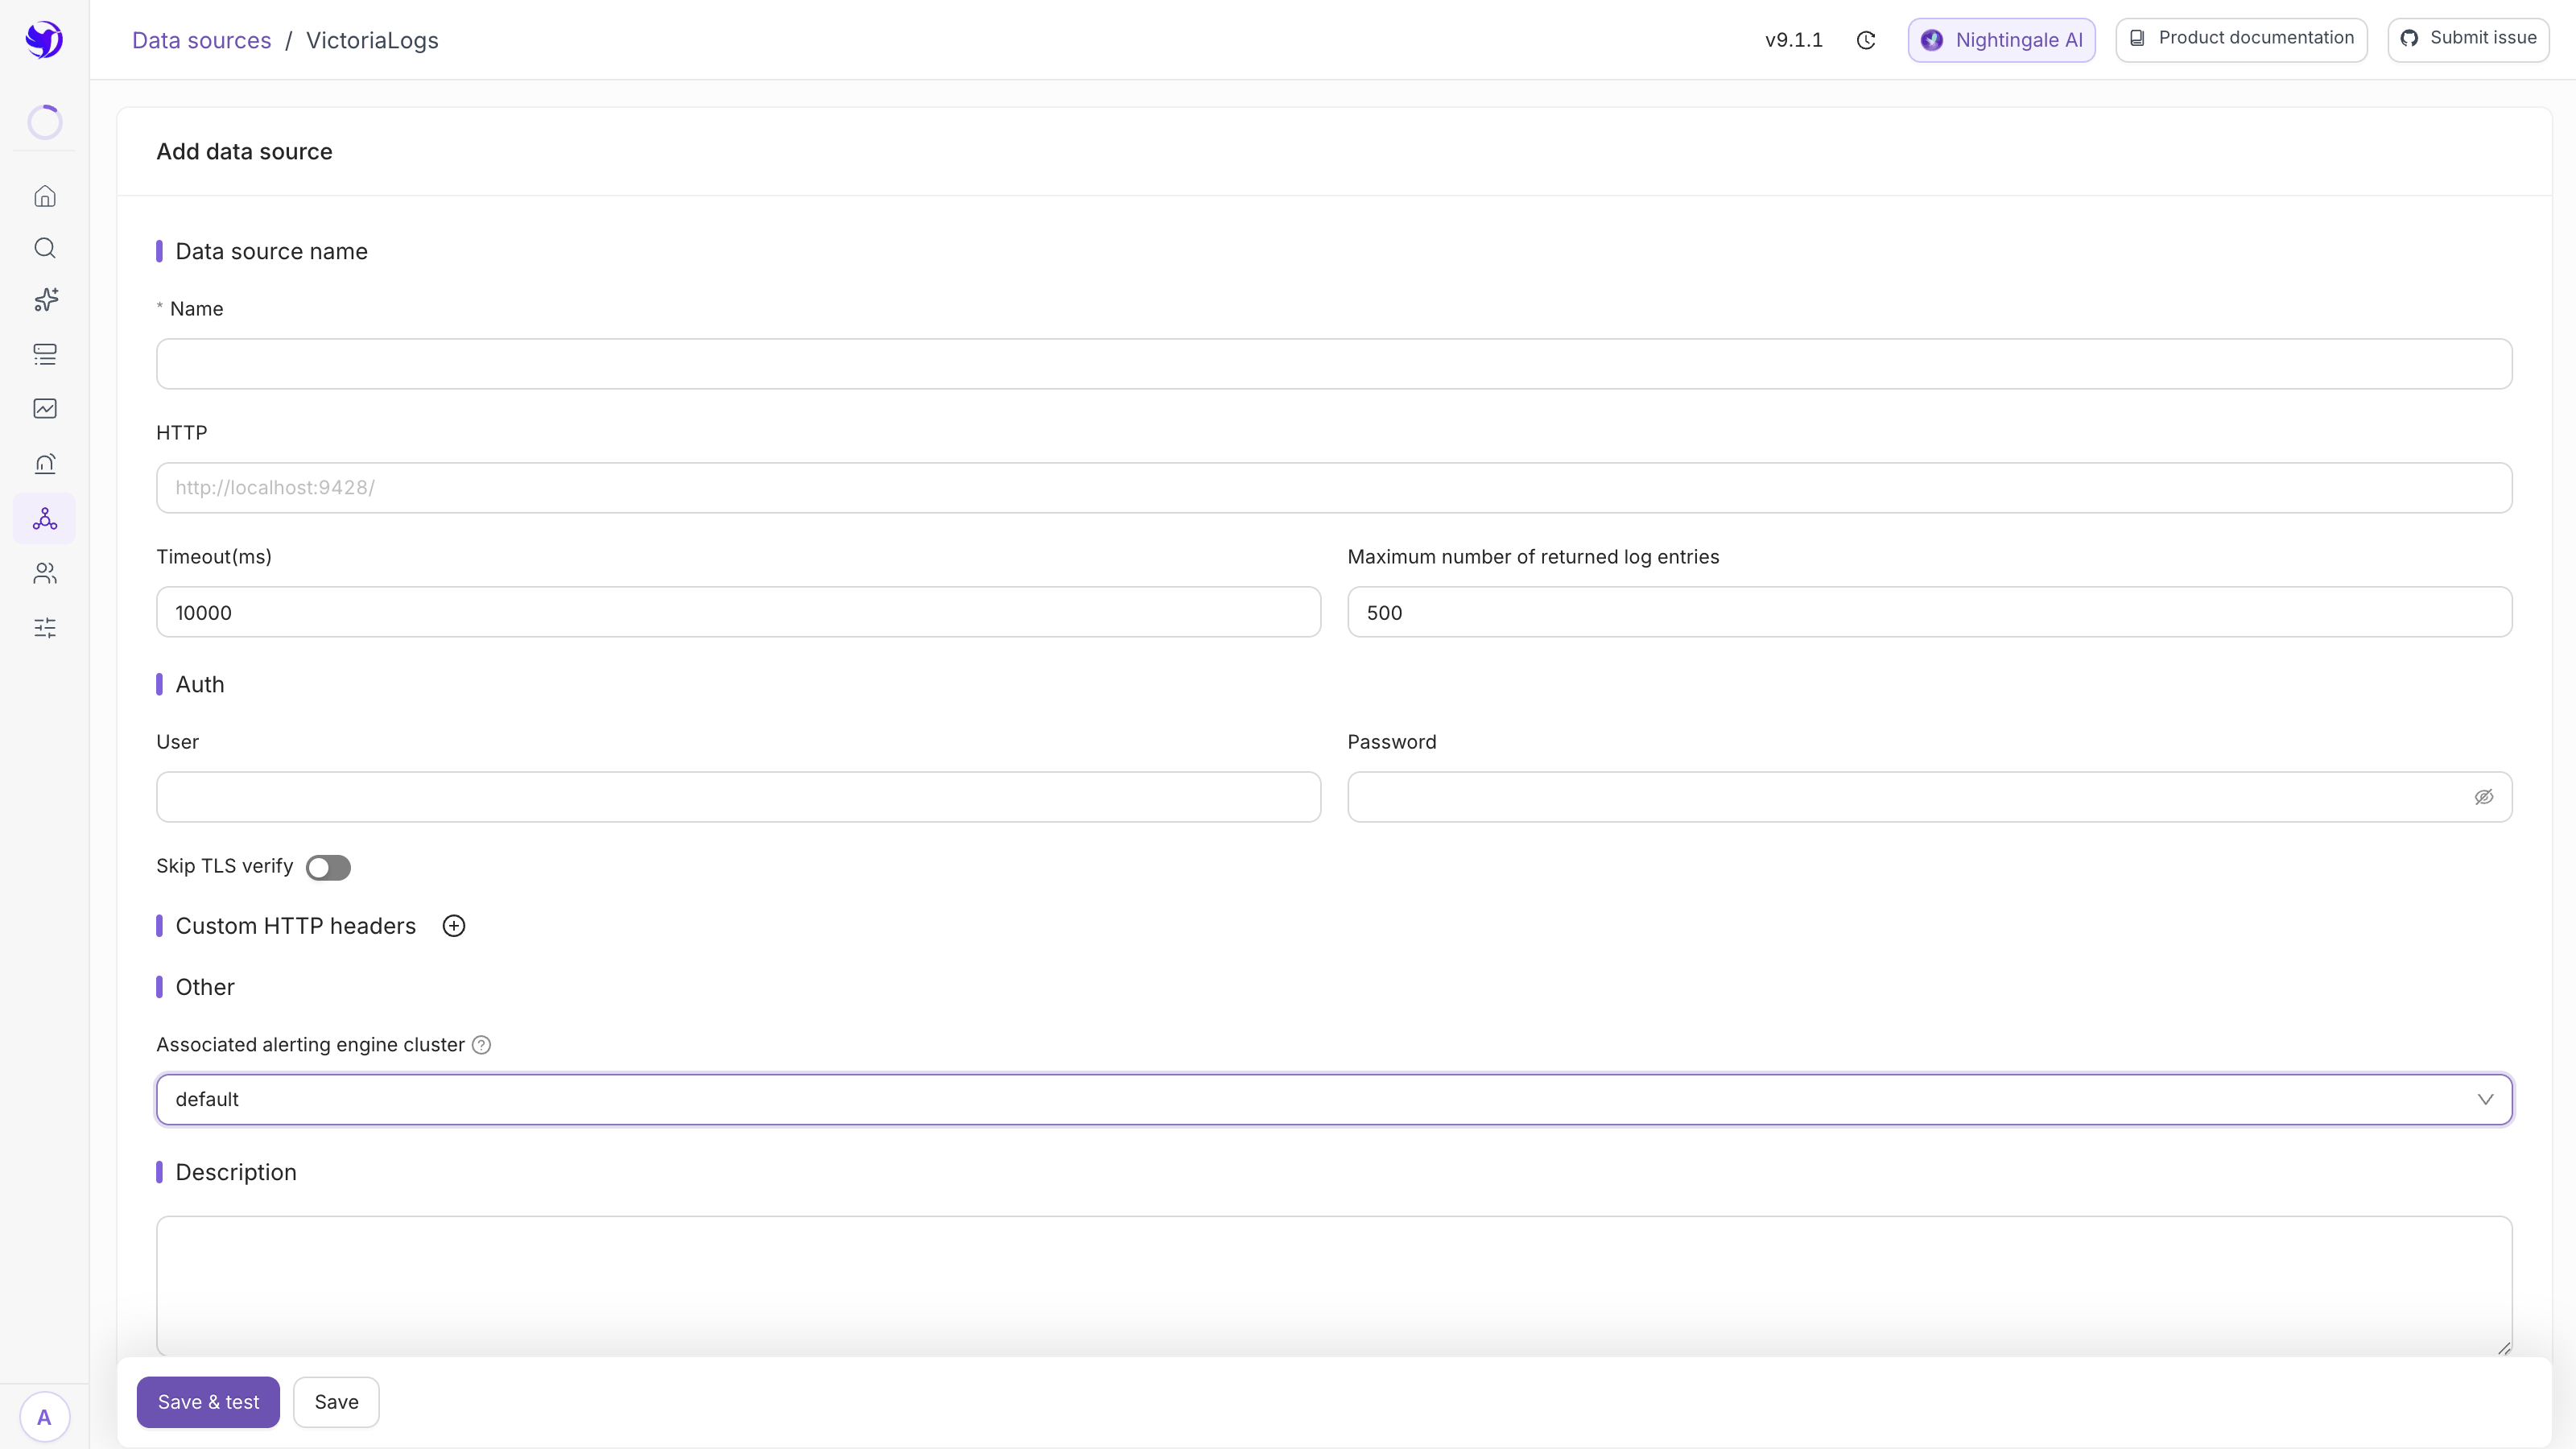
| Field | What to put in it |
|---|---|
| Name | Required |
| HTTP | The service address, http://localhost:9428/. No extra path suffix |
| Timeout(ms) | Defaults to 10000 |
| Maximum number of returned log entries | Defaults to 500. The per-query row cap; raise it too far and the browser suffers |
| User / Password | Fill these if auth is enabled |
| Custom HTTP headers | For a gateway that needs extra headers |
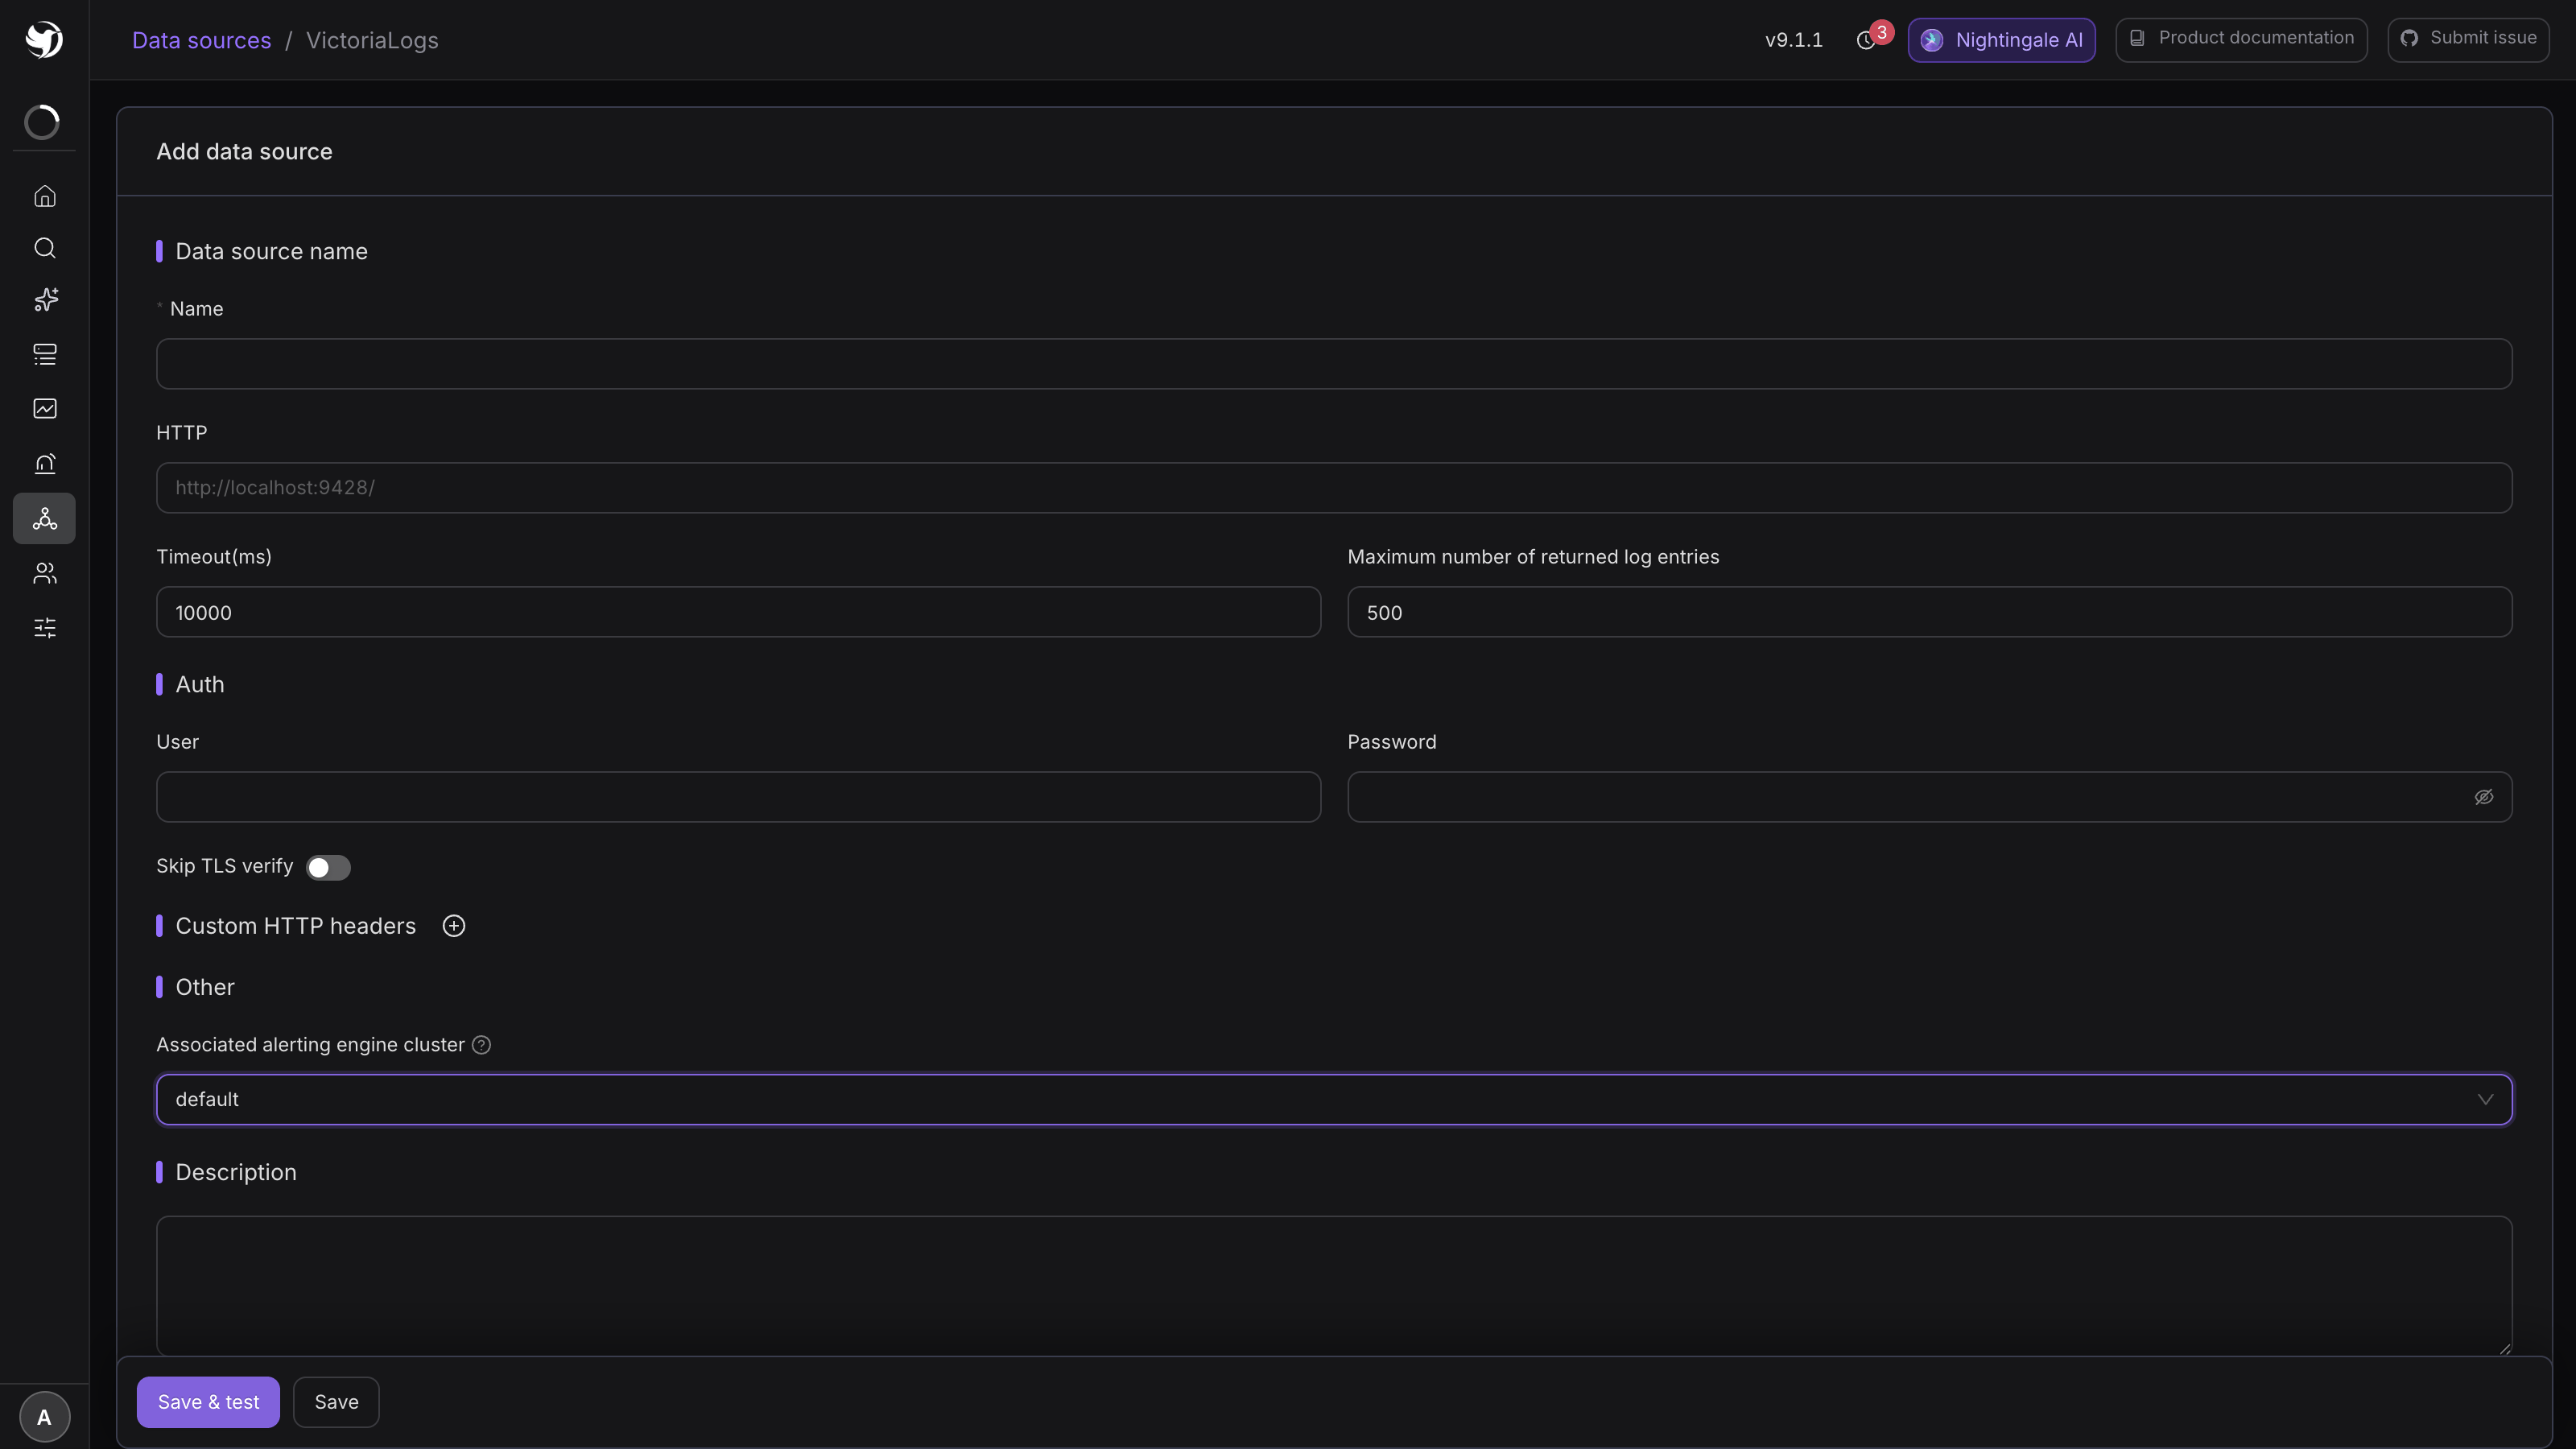
Querying: LogQL and LogsQL
Explorer → Logs, pick the source. The two query editors differ.
Loki speaks LogQL. You can type the query directly or fill in the builder field by field — labels, line filter, parser, parsed-field filter, limit, range aggregation. Typed by hand:
# every 401 line from one container
{container="checkout"} | json | status="401"

# how many 401s in the last five minutes
count_over_time({container="checkout"} |= "401" [5m])
The LogQL selector {label="value"} is mandatory — an empty query is rejected. The line filter has
four operators: |= contains, != does not contain, |~ regex match, !~ regex non-match. Use
| json, | logfmt or | pattern to parse fields out of the line before aggregating.
VictoriaLogs speaks LogsQL. Write the query in the box, cap the returned rows on the right, and read the result as a group, a table or JSON. To render it as a time series you also pick a value field (the numeric columns to plot, several allowed) and a label field (what separates one line from another).
_stream:{app="checkout"} AND status:401
If nothing comes back, check the time range first, then check whether the writer side (Promtail, Vector, vlogscli) is actually shipping.
Alerting on counts and matches
Alerts & Notifications → Alert rules → Add, data source type Loki or VictoriaLogs.
A log rule does not judge log lines directly — it judges a number the query produced. The common shape is one sentence: more than N lines matched this condition in the last N minutes.
In Loki you put the aggregation in the query itself:
count_over_time({container="checkout"} |= "ERROR" [5m])
with the threshold $A > 0 — "alert if ERROR appeared at all in the last five minutes". Swap the
keyword for a business error code or a stack-trace fingerprint and the rule shape carries over
unchanged.
In VictoriaLogs you run the query, pick the numeric column with the value field, and write the threshold against it.
Hit Preview before you set the threshold, to confirm the query returns the number you expect.
When it doesn't work
A 404 on save. The Loki URL is missing /loki.
It saved but returns no logs. In this order:
- Multi-tenant Loki without
X-Scope-OrgID; - LogQL with no label selector —
{}must contain at least one matcher; - Too narrow a time range;
- Nothing is being written at all. Confirm with
logcli(Loki) or by curling the VictoriaLogs query endpoint directly.
The rule never fires. Run the same query in the Log explorer first and confirm it returns a non-zero result; then check that the data source is associated with an alerting engine cluster.
Next
- Writing log rules properly: Log alert rules
- Search technique: Log explorer and index patterns
- Using ES instead: ElasticSearch / OpenSearch