Auto-registered Embedded TSDB datasource
A fresh install auto-registers a Prometheus-type source named embedded-tsdb; Pushgw writes into it by default, and it is queried like any external Prometheus source.
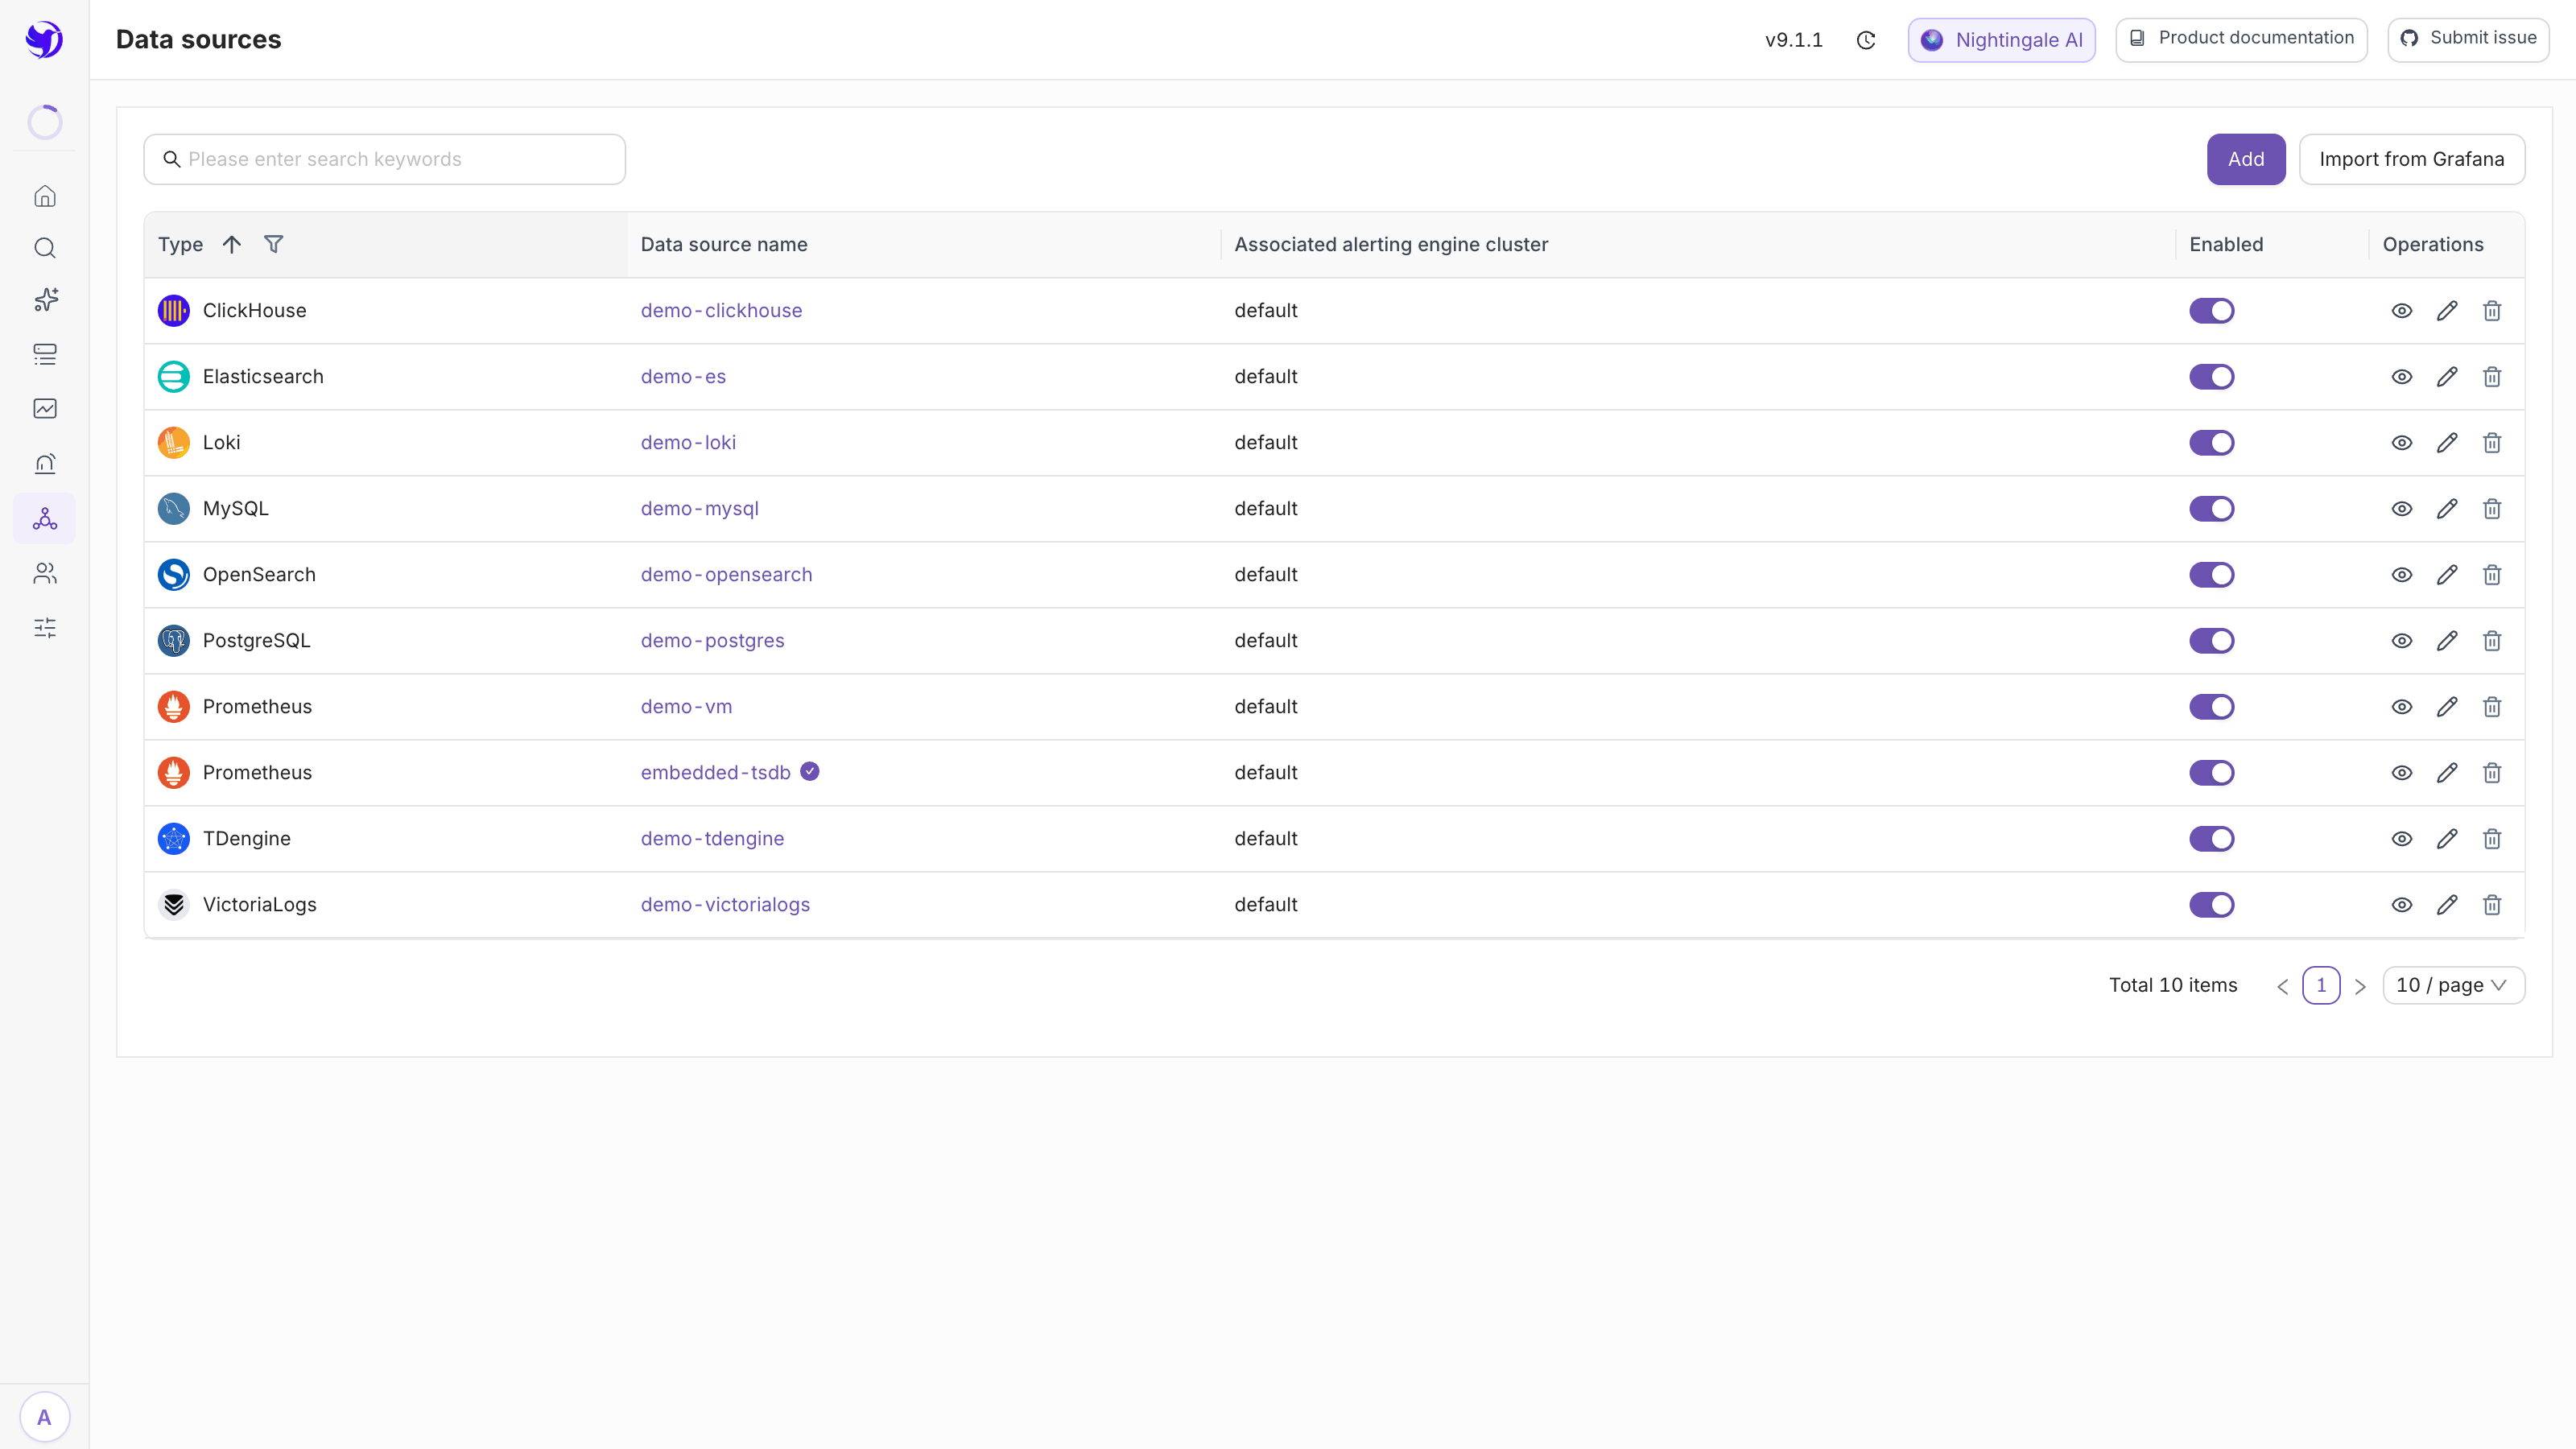
Open Integrations → Data sources on a fresh install and there is already a Prometheus-type
source named embedded-tsdb, carrying a default badge. This page explains who created it, what
writes into it, and how it actually differs from an external Prometheus source you add yourself.
Who creates it
At startup, as long as [EmbeddedTSDB] Enable = true (the default), the Center process inserts one
row into the data source table:
| Field | Value |
|---|---|
| Name | embedded-tsdb |
| Type | Prometheus |
| URL | http://127.0.0.1:17000/prometheus |
| Time series database type | Prometheus |
| Created by | system |
| Default data source | yes |
The action is idempotent: on every restart, if the URL, the auth or the time series database type
have drifted from the current config, they are written back. Editing this record's URL therefore
achieves nothing — the next restart undoes it. It recognises itself through an internal
identifier (n9e-embedded-tsdb), so renaming it is safe.
The default badge is set by the server (is_default). The open-source form has no checkbox for it;
you neither need to nor can toggle it by hand.
What writes into it
Categraf pushes metrics to Nightingale's /prometheus/v1/write, and the forwarding layer then
writes those samples to this instance's own /prometheus/api/v1/write as if it were any other
remote write backend. In other words, the embedded store is fed through the Pushgw.Writers
path — the writer entry is just injected at startup, so you never see it in the config file.
The consequence is that every forwarding behaviour an external store gets, the embedded one gets
too: server-side timestamps, target label rewriting (Pushgw.LabelRewrite), write statistics.
How it differs from an external Prometheus source
At the query interface, it doesn't. Nightingale serves a Prometheus-compatible HTTP API in front
of it — /api/v1/query, /api/v1/query_range, /api/v1/series, /api/v1/labels — so rules,
dashboards and the Metrics explorer behave identically.
Three things are genuinely different:
- It only accepts local requests by default. With no
BasicAuthUserconfigured,/prometheus/api/v1/*admits requests from this machine only, which is why the auto-registered URL is127.0.0.1. To letn9e-edge, Grafana or an agent talk to it directly, configure basic auth — the auto-registered URL then switches to the detected host IP.DatasourceUrllets you pin a VIP or domain instead, and setting it also lifts the local-only restriction; - The data lives on the local disk of one Center process. With several replicas each holds a fragment, so high availability means turning it off;
- Administrative endpoints such as delete-series are not registered at all by default. Set
EnableAdminAPI = trueto get them, and configure basic auth first.
When it is not created
If Center finds an enabled Prometheus-type data source already exists at startup, it skips the auto-registration and says so in the log. That keeps a deployment that already points at an external store from sprouting an extra data source.
Note that samples are still written to the local store in that case — there is simply nothing
pointing at it. To query them, create a Prometheus data source aimed at
http://127.0.0.1:17000/prometheus; if you don't want the local store at all, set
[EmbeddedTSDB] Enable = false.
Retention and capacity
[EmbeddedTSDB]
Enable = true
Dir = "data/tsdb"
RetentionDuration = "15d"
MaxBytes = "10GiB"
OutOfOrderTimeWindow = "10m"
QueryTimeout = "1m"
QueryMaxSamples = 50000000
Exceeding MaxBytes deletes the oldest blocks first. OutOfOrderTimeWindow is the tolerance for
out-of-order samples — it absorbs agent clock skew and resends.
Only the Center process reads this section. n9e-edge, n9e-alert and n9e-pushgw read the
same etc directory, ignore it, and print a warning at startup if it is enabled.
Next
- Where it stops being enough: Embedded TSDB single-Center limits
- Moving to an external store: External TSDB and dual-write migration
- Nothing in it: No data in the embedded TSDB
- How the two kinds of storage divide up: Embedded TSDB and external storage