Prometheus
Register a Prometheus or Thanos endpoint, set auth and timeouts, and verify with a query.
Where this page ends: a registered Prometheus data source whose connection has been tested and which returns a line in the Metrics explorer. Thanos, Mimir, M3 and VictoriaMetrics all implement Prometheus's query API and use this same type (VictoriaMetrics has one extra switch — see VictoriaMetrics).
Nothing is moved. A data source is a connection: Nightingale queries your store where it is, and your scrape config stays exactly as it is.
Before you start
- The query endpoint of your Prometheus, e.g.
http://10.0.0.11:9090; - Network access to it from the machine running Nightingale Center — your browser being able to reach it is not the same thing;
- Credentials, if the endpoint is behind auth;
- An Admin account — adding a data source is an admin operation, and the Add button is hidden from everyone else.
1. Add the data source
Integrations → Data sources → Add, then pick Prometheus from the type list.
Only two fields are required:
| Field | What to put in it |
|---|---|
| Name | Something you will recognise. Rules and queries pick the source by this name |
| URL | The query endpoint, up to the port. Nightingale appends /api/v1/... itself |
The form lists the shape for each product:
1. Prometheus                      http://localhost:9090/
2. Thanos                          http://localhost:19192/
3. VictoriaMetrics Cluster         http://{vmselect}:8481/select/0/prometheus/
4. VictoriaMetrics Single-Node     http://{vmselect}:8428/
5. M3                              http://localhost:7201/
6. SLS                             https://{project}.{sls-endpoint}/prometheus/{project}/{metricstore}/
7. Mimir                           http://mimir:9009/prometheus
Timeout(ms) defaults to 10000. Raise it for a large, slow cluster, but not to minutes — the alerting engine evaluates on a schedule, and one stuck query holds up a whole batch of rules.
2. Auth and TLS
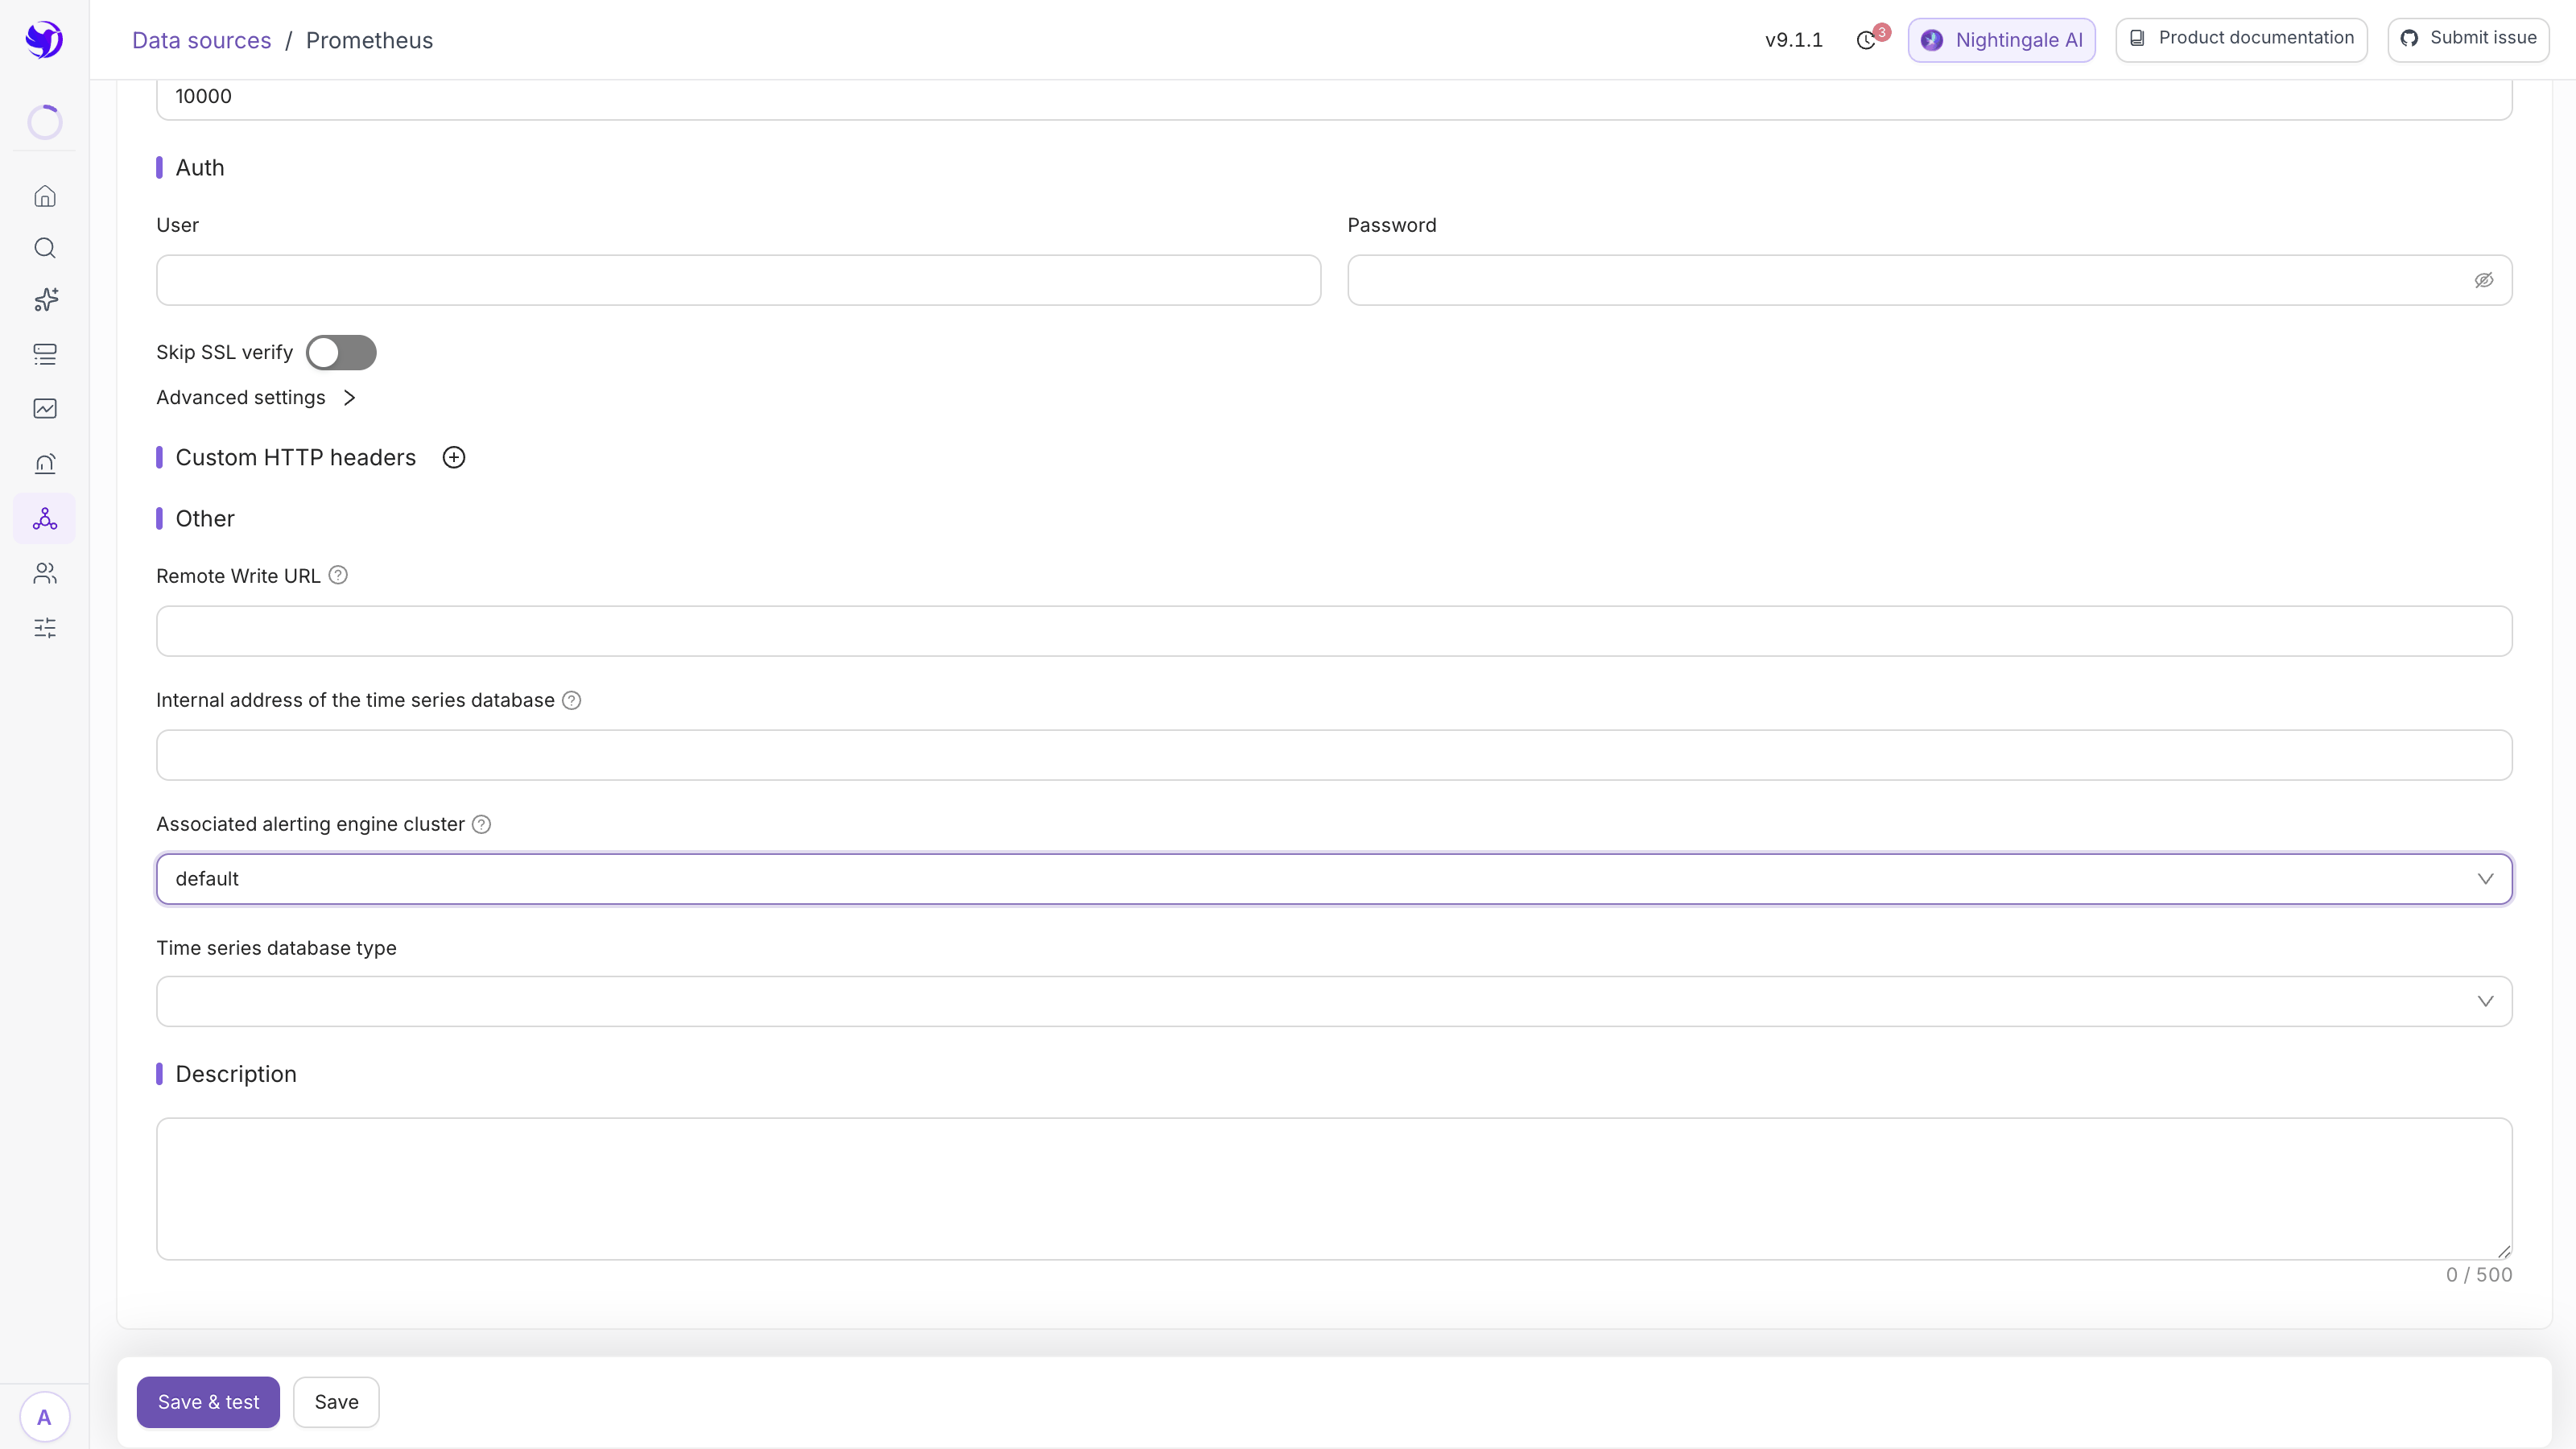
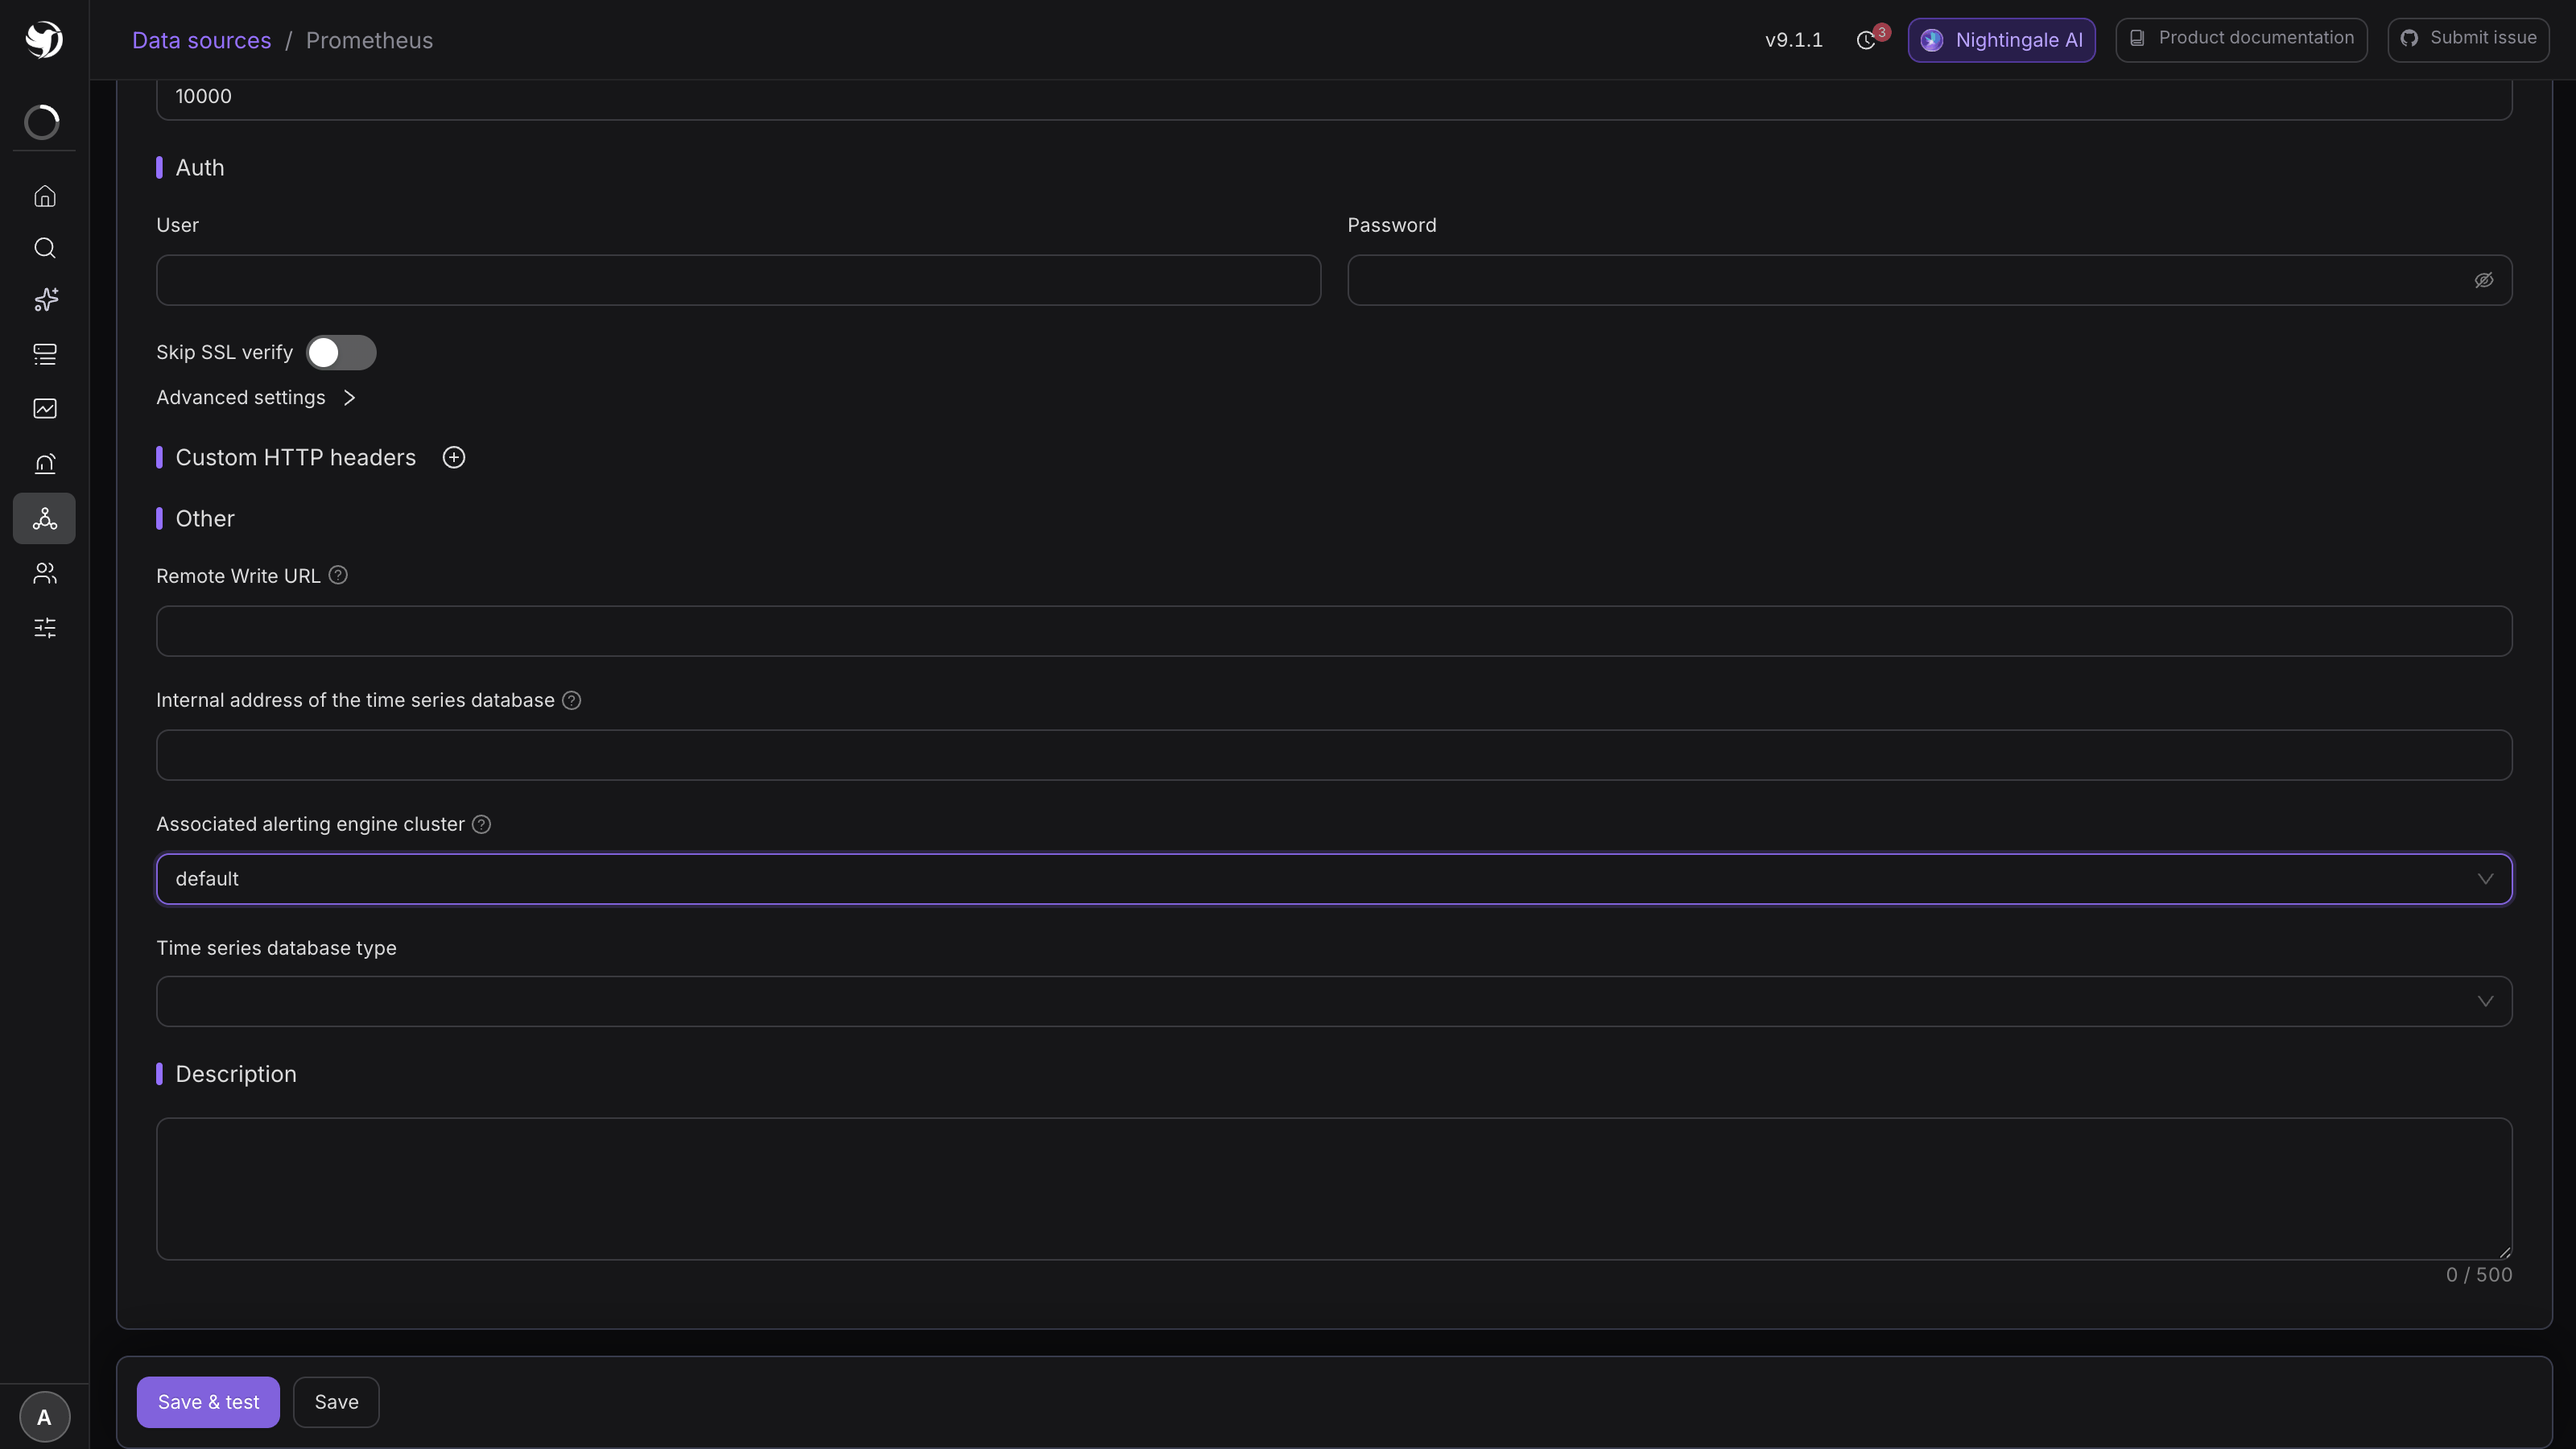
- User / Password: fill these if Prometheus has basic auth enabled. Use the plain password,
not the bcrypt hash from
basic_auth_usersinweb-config.yml; - Skip SSL verify: turn it on for a self-signed certificate;
- Advanced settings holds the four mutual-TLS fields — CA certificate, Server name, Client
certificate, Client key. Paste the certificate body, starting at
-----BEGIN CERTIFICATE-----; - Custom HTTP headers: add Header / Value pairs when a gateway in front requires a token.
3. Three more fields
None of these are required, but getting them wrong bites you somewhere else:
| Field | When you need it |
|---|---|
| Remote Write URL | Only when you use recording rules. The new series a recording rule computes are written back to this address. For Prometheus that is http://localhost:9090/api/v1/write, for single-node VictoriaMetrics http://localhost:8428/api/v1/write |
| Internal address of the time series database | Only when the alerting engine is deployed down in an edge data center. When set, n9e-edge uses this address to reach the store; when empty it uses the URL above |
| Time series database type | Prometheus / Thanos / VictoriaMetrics / M3 / SLS. It changes how dashboard variables are resolved and which endpoint "delete series" calls, so pick the right one for VictoriaMetrics |
Leave Associated alerting engine cluster at default if you run a single engine. If this field
is empty, rules against this data source are never evaluated.
4. Verify
Click Save & test. Nightingale issues one /api/v1/query?query=1%2B1 against the address; the
record is only stored if that succeeds, and a failure is reported verbatim without saving.
If the endpoint genuinely is not reachable yet but you want the config stored, use Save.
After a successful save a result panel opens. For Prometheus-type sources it also runs a data health check:
- N metrics found · latest data X ago — everything works;
- Connected, but no metrics found — the connection is fine but the store is empty, usually because no collector is writing yet;
- Historical data exists, but nothing recent — metrics are there but no fresh samples; go check whether your collectors are still running.
Then confirm it yourself: Explorer → Metrics, pick the source you just created, and run a query you know returns data:
up
A line on the chart means this half works. If nothing comes back, stop here — Data source connects but queries return no data.
When it doesn't connect
The test returns 404. The URL includes a path such as http://host:9090/api/v1/query. Trim it
back to the port.
The test returns 401 / 403. Either the basic auth password was entered as a hash, or a gateway in front of Prometheus needs an auth header added under Custom HTTP headers.
Nightingale gets a 404 forwarding samples to Prometheus. That is the write path, not the data
source. Prometheus does not accept remote write by default; start it with
--web.enable-remote-write-receiver (older versions: --enable-feature=remote-write-receiver).
Saved fine, but rules never evaluate. Check that Associated alerting engine cluster is not empty.
Next
- Write the first rule against it: Your first alert rule
- Query ad hoc: Metrics explorer
- Moving to VictoriaMetrics: VictoriaMetrics
- Nothing collecting yet: Install Categraf