ElasticSearch / OpenSearch
Connect an ES or OpenSearch cluster, choose index patterns and the timestamp field, and run a log query.
Where this page ends: a connected ES cluster, one reusable index pattern, and a query that returns real log lines in the Log explorer.
One difference up front, because it changes how you will use this: in the open-source edition ElasticSearch works in the Log explorer and on dashboards, while OpenSearch is only usable for alert rules. Both register as data sources and both drive log alert rules, but the OpenSearch explorer and dashboards are not available. If you want to search logs, use the ElasticSearch type.
Before you start
- The HTTP endpoint of your cluster, e.g.
http://10.0.0.21:9200; - Network access to it from the machine running Nightingale Center;
- Credentials — ES 8.x enables X-Pack security by default;
- A date-typed field in the index (usually
@timestamp); Nightingale filters the time range on it.
1. Register the cluster
Integrations → Data sources → Add → Elasticsearch.
The HTTP section is a list you can extend: click the + next to the heading to add more node
addresses, and Nightingale rotates between them.
| Field | Notes |
|---|---|
| Name | Required; rules and queries pick the source by this name |
| HTTP | Node address in the form http://localhost:9200. At least one |
| Timeout(ms) | Defaults to 10000 |
| User / Password | Fill these if auth is on. ES 8.x requires them by default |
| Version | Leave it blank — Nightingale detects it on save. To pin one, use x.y.z, e.g. 7.10.2 |
| Max concurrent shard requests | Defaults to 5. Lower it on a cluster with very many shards so one query cannot saturate ES |
| Min time interval (s) | Defaults to 10. The lower bound for automatic time bucketing; set it to your write frequency — 60 if data lands once a minute |
The Enable write switch is unused in the open-source edition; leave it off.
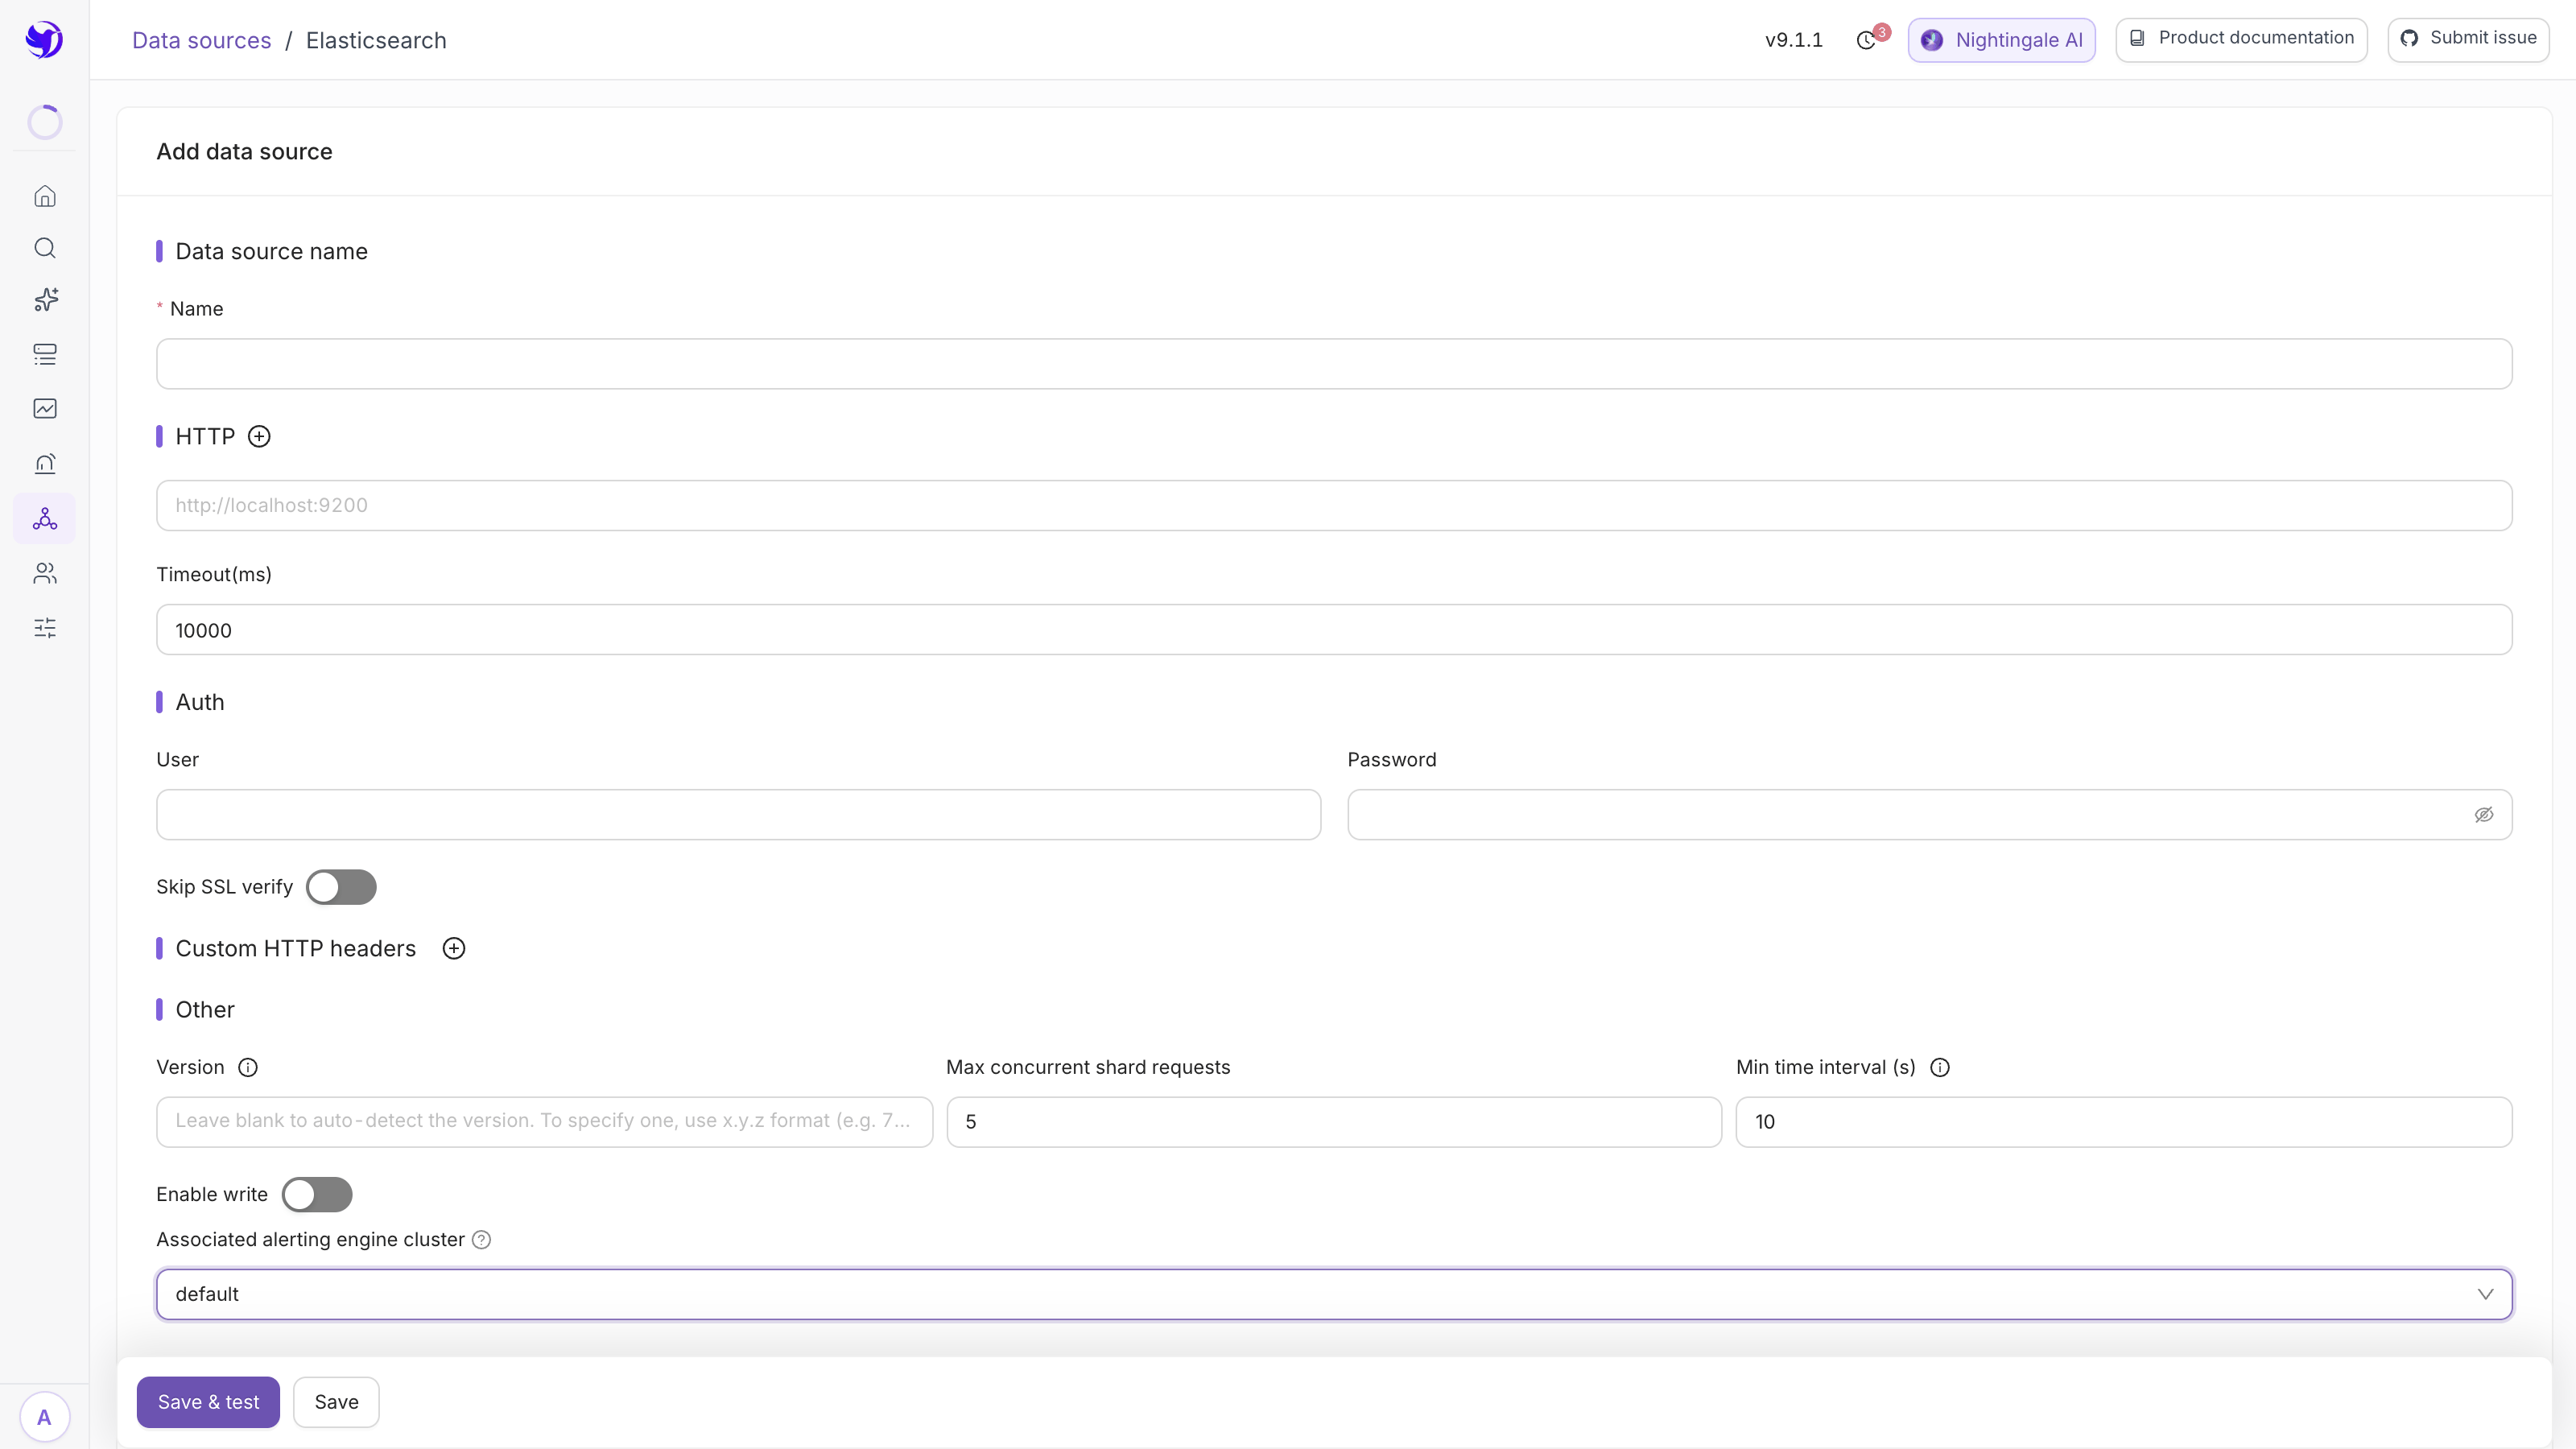
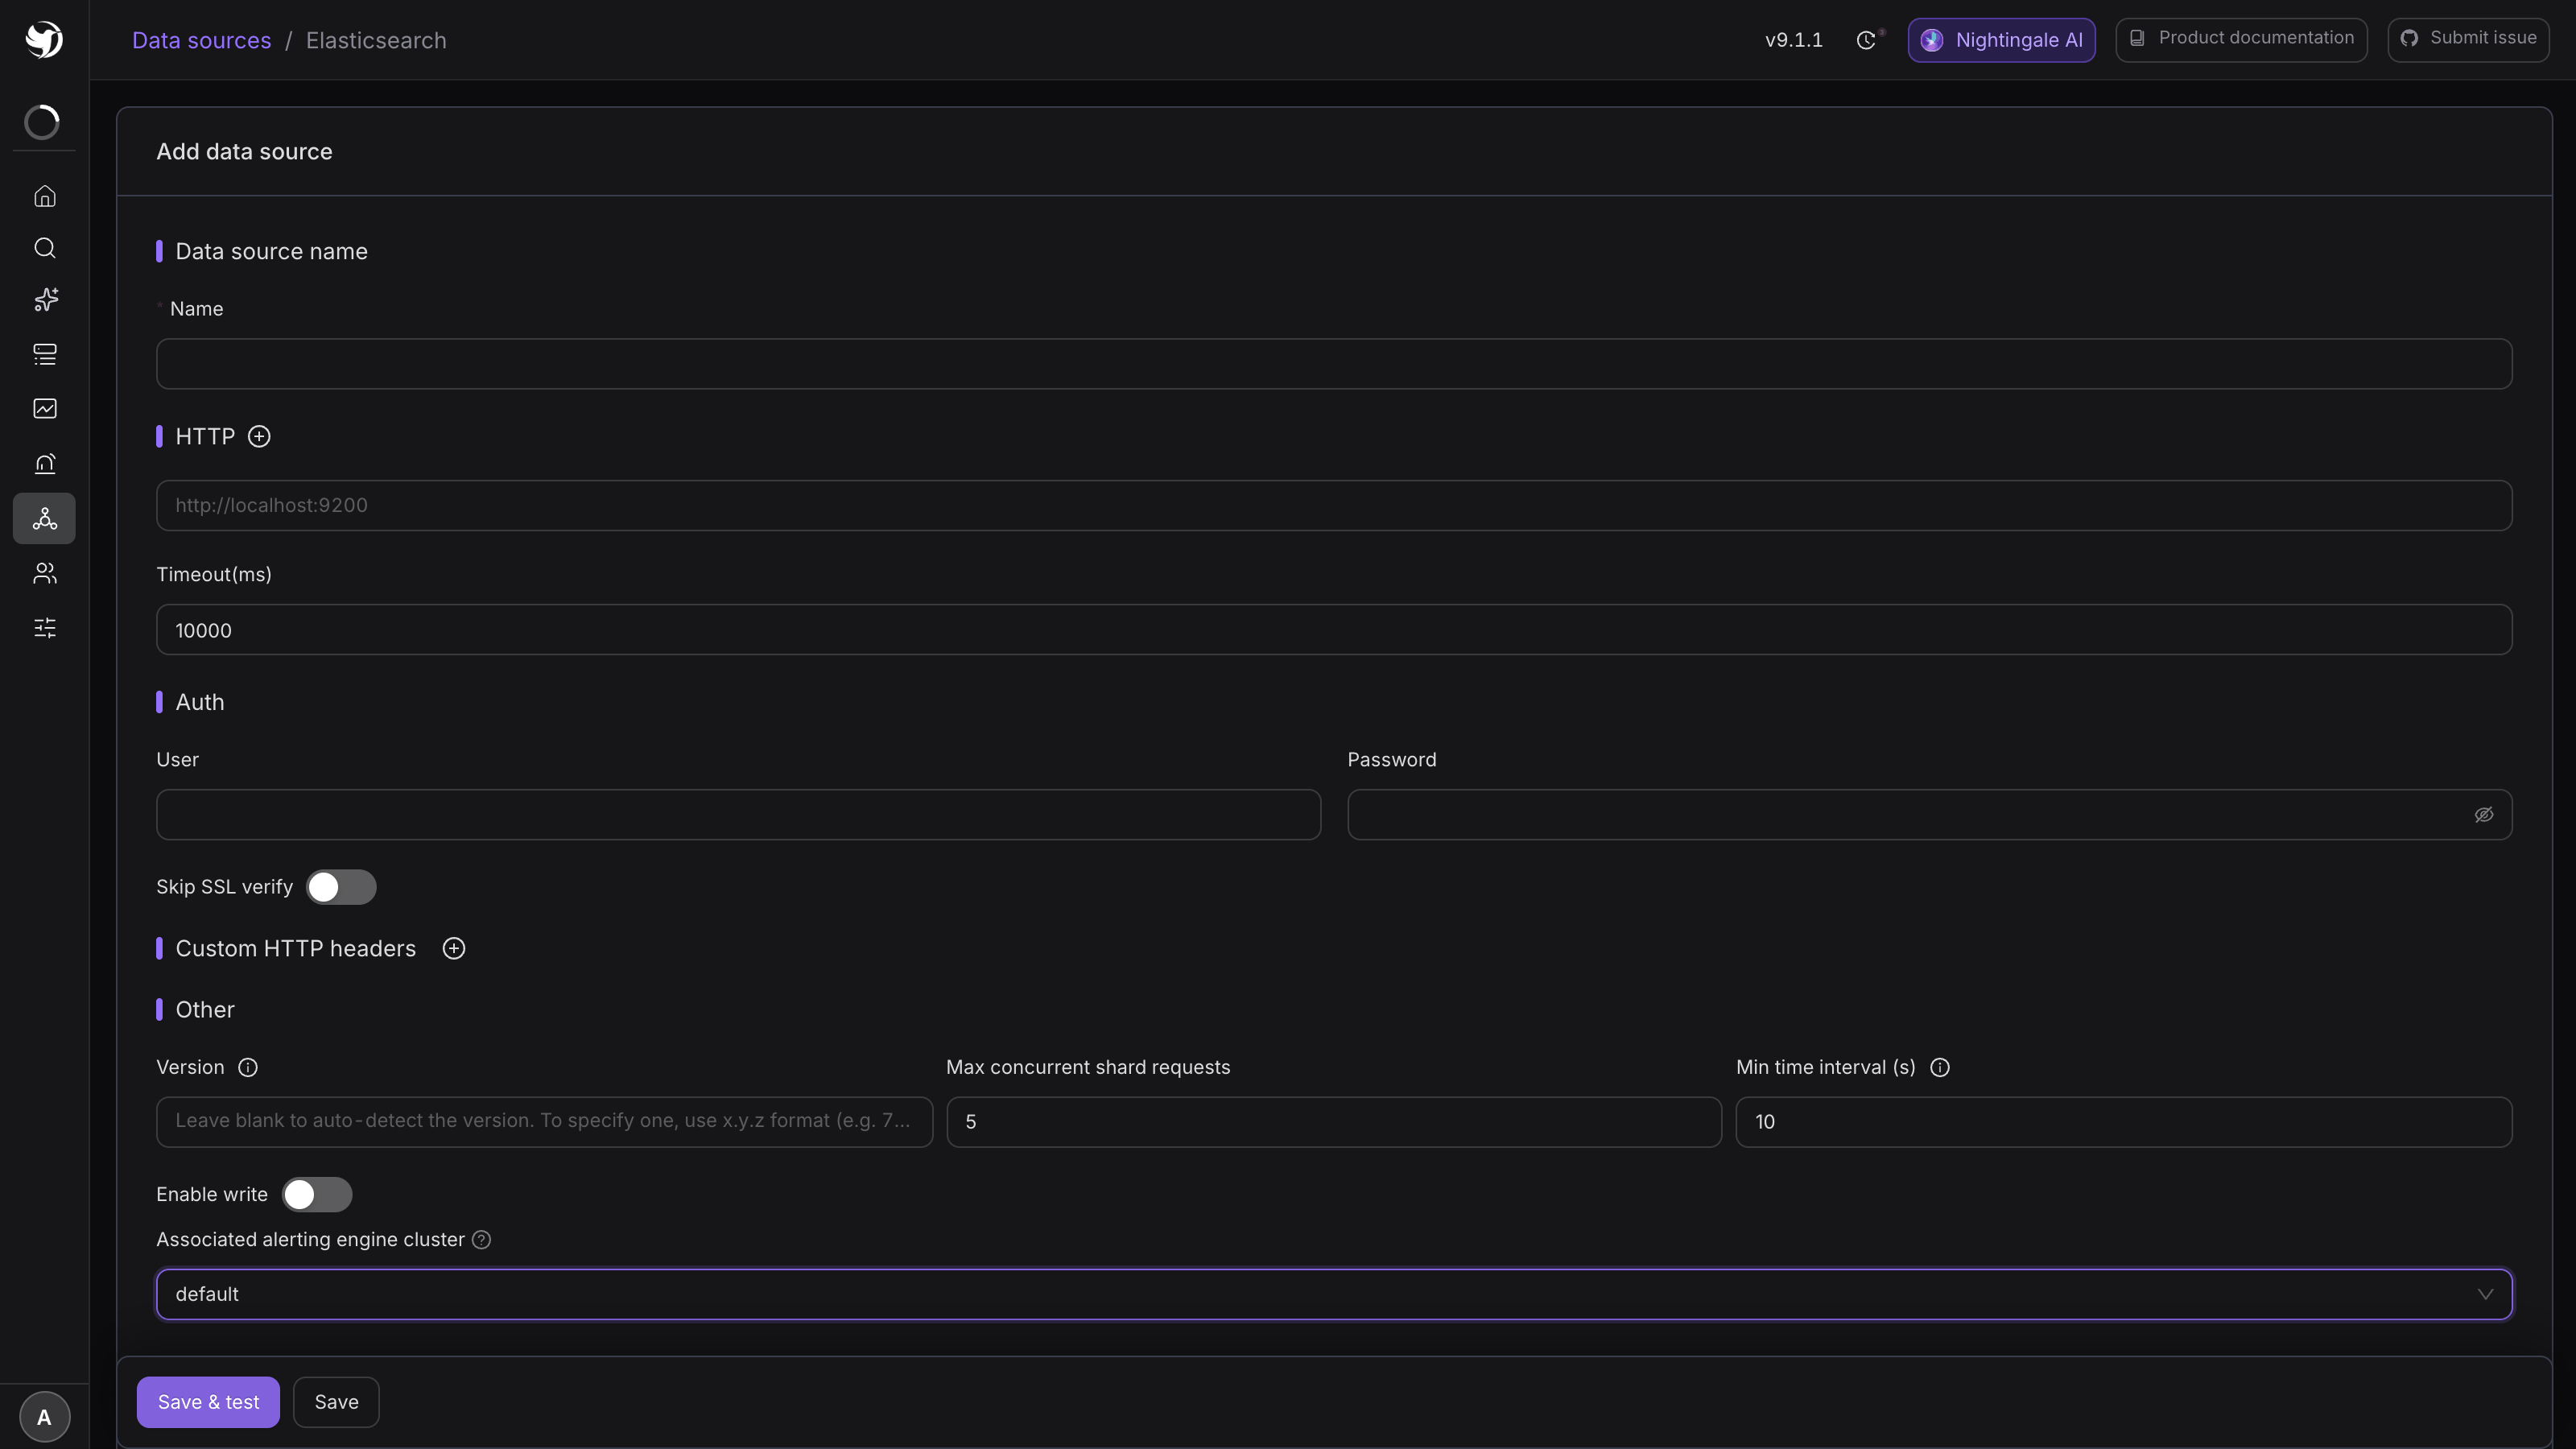
Click Save & test. For ES, that step fetches the version number: on success the version is stored with the config, and on failure the record is still saved with the reason shown in the result panel — so when you see "Saved, connectivity not verified", read the reason before moving on.
2. Define an index pattern
There are two ways to say which data a query covers:
- Indices — type an index name directly; wildcards work, e.g.
log-*. Good for a one-off look; - Index patterns — a stored definition that binds an index name to its time field, which queries and alert rules then select by name.
Index patterns are managed at /log/index-patterns (the gear icon next to the index-pattern
box in the ES query editor links there). Click Create index pattern; each one holds:
| Field | What to put in it |
|---|---|
| Data source | Which ES data source it belongs to |
| Name | Index name or wildcard, e.g. log-prod-* |
| Time field | The date field, such as @timestamp |
Those three plus an operations column are exactly what the list shows. An index pattern referenced by an alert rule cannot be deleted; the attempt is refused.
Why bother — the time field is answered once. From then on no query and no rule has to answer "which field is the timestamp" again.
3. Run a log query
Explorer → Logs, then select the source you just created. On the left, in order:
- Mode:
IndicesorIndex patterns; - Index / Index pattern;
- Date field (only needed separately in Indices mode);
- Syntax: KQL or Lucene;
- Query, e.g.
status:500 AND method:GET.
Log lines appearing means the path works. If nothing comes back, check the time range first — the picker in the top right defaults to a recent window, and older logs need it widened.
4. Alert on the result
A log rule differs from a metric rule only in what it queries: a metric rule writes PromQL, a log rule runs a query that produces a number, and the threshold expression judges that number.
Under Alerts & Notifications → Alert rules → Add, pick Elasticsearch (or OpenSearch) as the data source type. Besides index, time field and query, there are two extra groups:
- Value field — which number takes part in the judgement. Beyond count, sum, avg, min and max, percentile functions such as p90 / p95 / p99 are available;
- Group By — split by a field. Each group becomes its own series, judged independently, and produces its own event carrying the group value as a label.
Three shapes you can copy directly:
- More than two 4xx lines in ten minutes, per host: filter to 4xx in the query, value field
count, group by
host.hostname, threshold> 2; - p95 request latency above 1700 ms: value field p95 over
request_time, group byremote_addr; - More than ten slow requests: query
request_time > 1900, value field count, group byrequest_uri.
Click Preview before setting the threshold, to confirm the query really returns the number you expect.
What is different for OpenSearch
OpenSearch is a fork of ES 7.10 and the form is nearly identical (the timeout defaults to 100000 rather than 10000). In the open-source edition, though:
- you can register the data source and can write log alert rules against it;
- you cannot search it in the Log explorer or chart it on a dashboard — neither supports it, and OpenSearch sources do not appear in those data source pickers.
So if your workflow is "look at the logs, then decide what to alert on", register the cluster under the ElasticSearch type.
When it doesn't work
The version fetch fails on save. From the Nightingale Center host, run
curl http://<es>:9200/_cluster/health. No 200 means network or auth. ES 8.x ships a self-signed
certificate, so turn on Skip SSL verify.
Indices are listed but no data comes back. Check three things in order: the date field is the right one, the wildcard actually matches a real index, and the time range genuinely contains data.
Several clusters. One data source per cluster. To span indices within one cluster, use a
wildcard (log-prod-*).
Next
- Write log rules properly: Log alert rules
- Search technique and index patterns in depth: Log explorer and index patterns
- A different log store: Loki / VictoriaLogs