Create the first rule
A rule from scratch: pick the source, write the query, set severity, test fire it, and watch the event appear.
Where this page ends: one rule you wrote yourself has produced a real event, and you have seen it in the event list. About 10 minutes. The rule will be deliberately trivial — the point is to prove the chain works end to end before you start worrying about thresholds.
Before you start
- Nightingale is running and you can log in;
- at least one data source is registered — the built-in TSDB counts. If not, start at Data sources;
- you can query that source and get data back. Check in Explorer → Metrics first; if nothing comes back, fix that before writing a rule.
1. Open the form
Alerts & Notifications → Alert rules. Pick a business group in the left tree — the rule belongs to it, and so will every event it produces. Then Add.
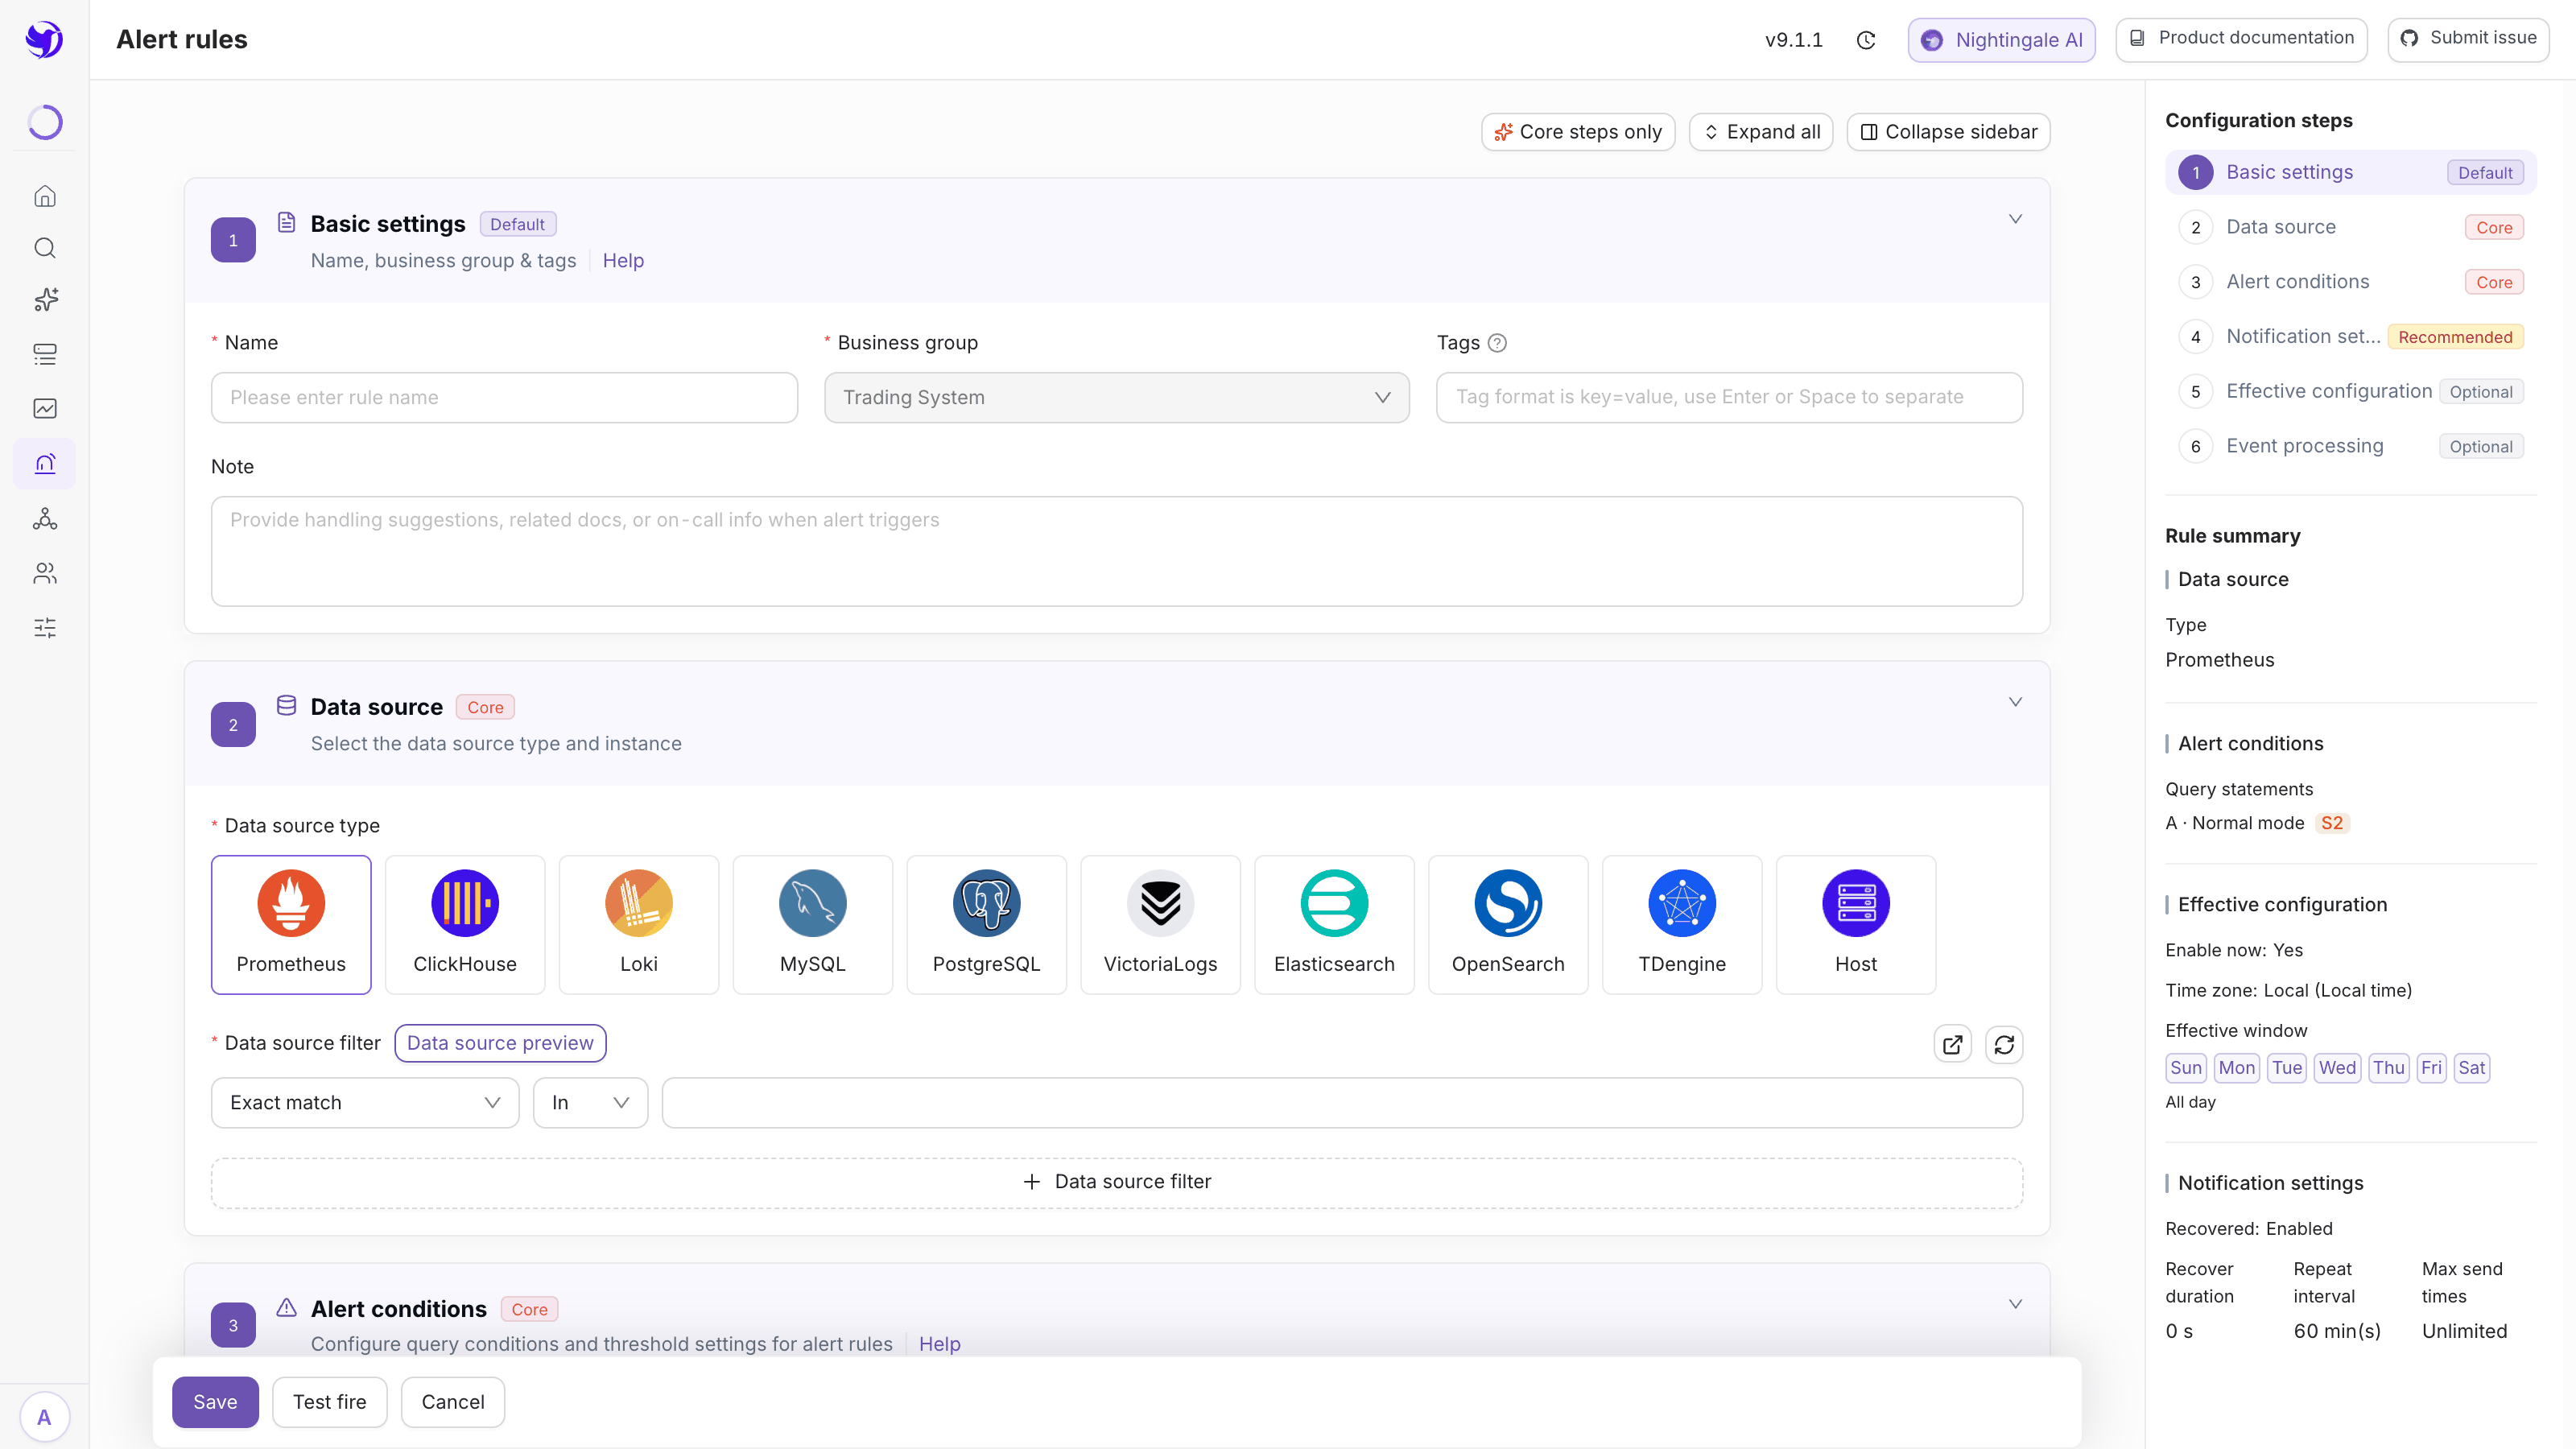
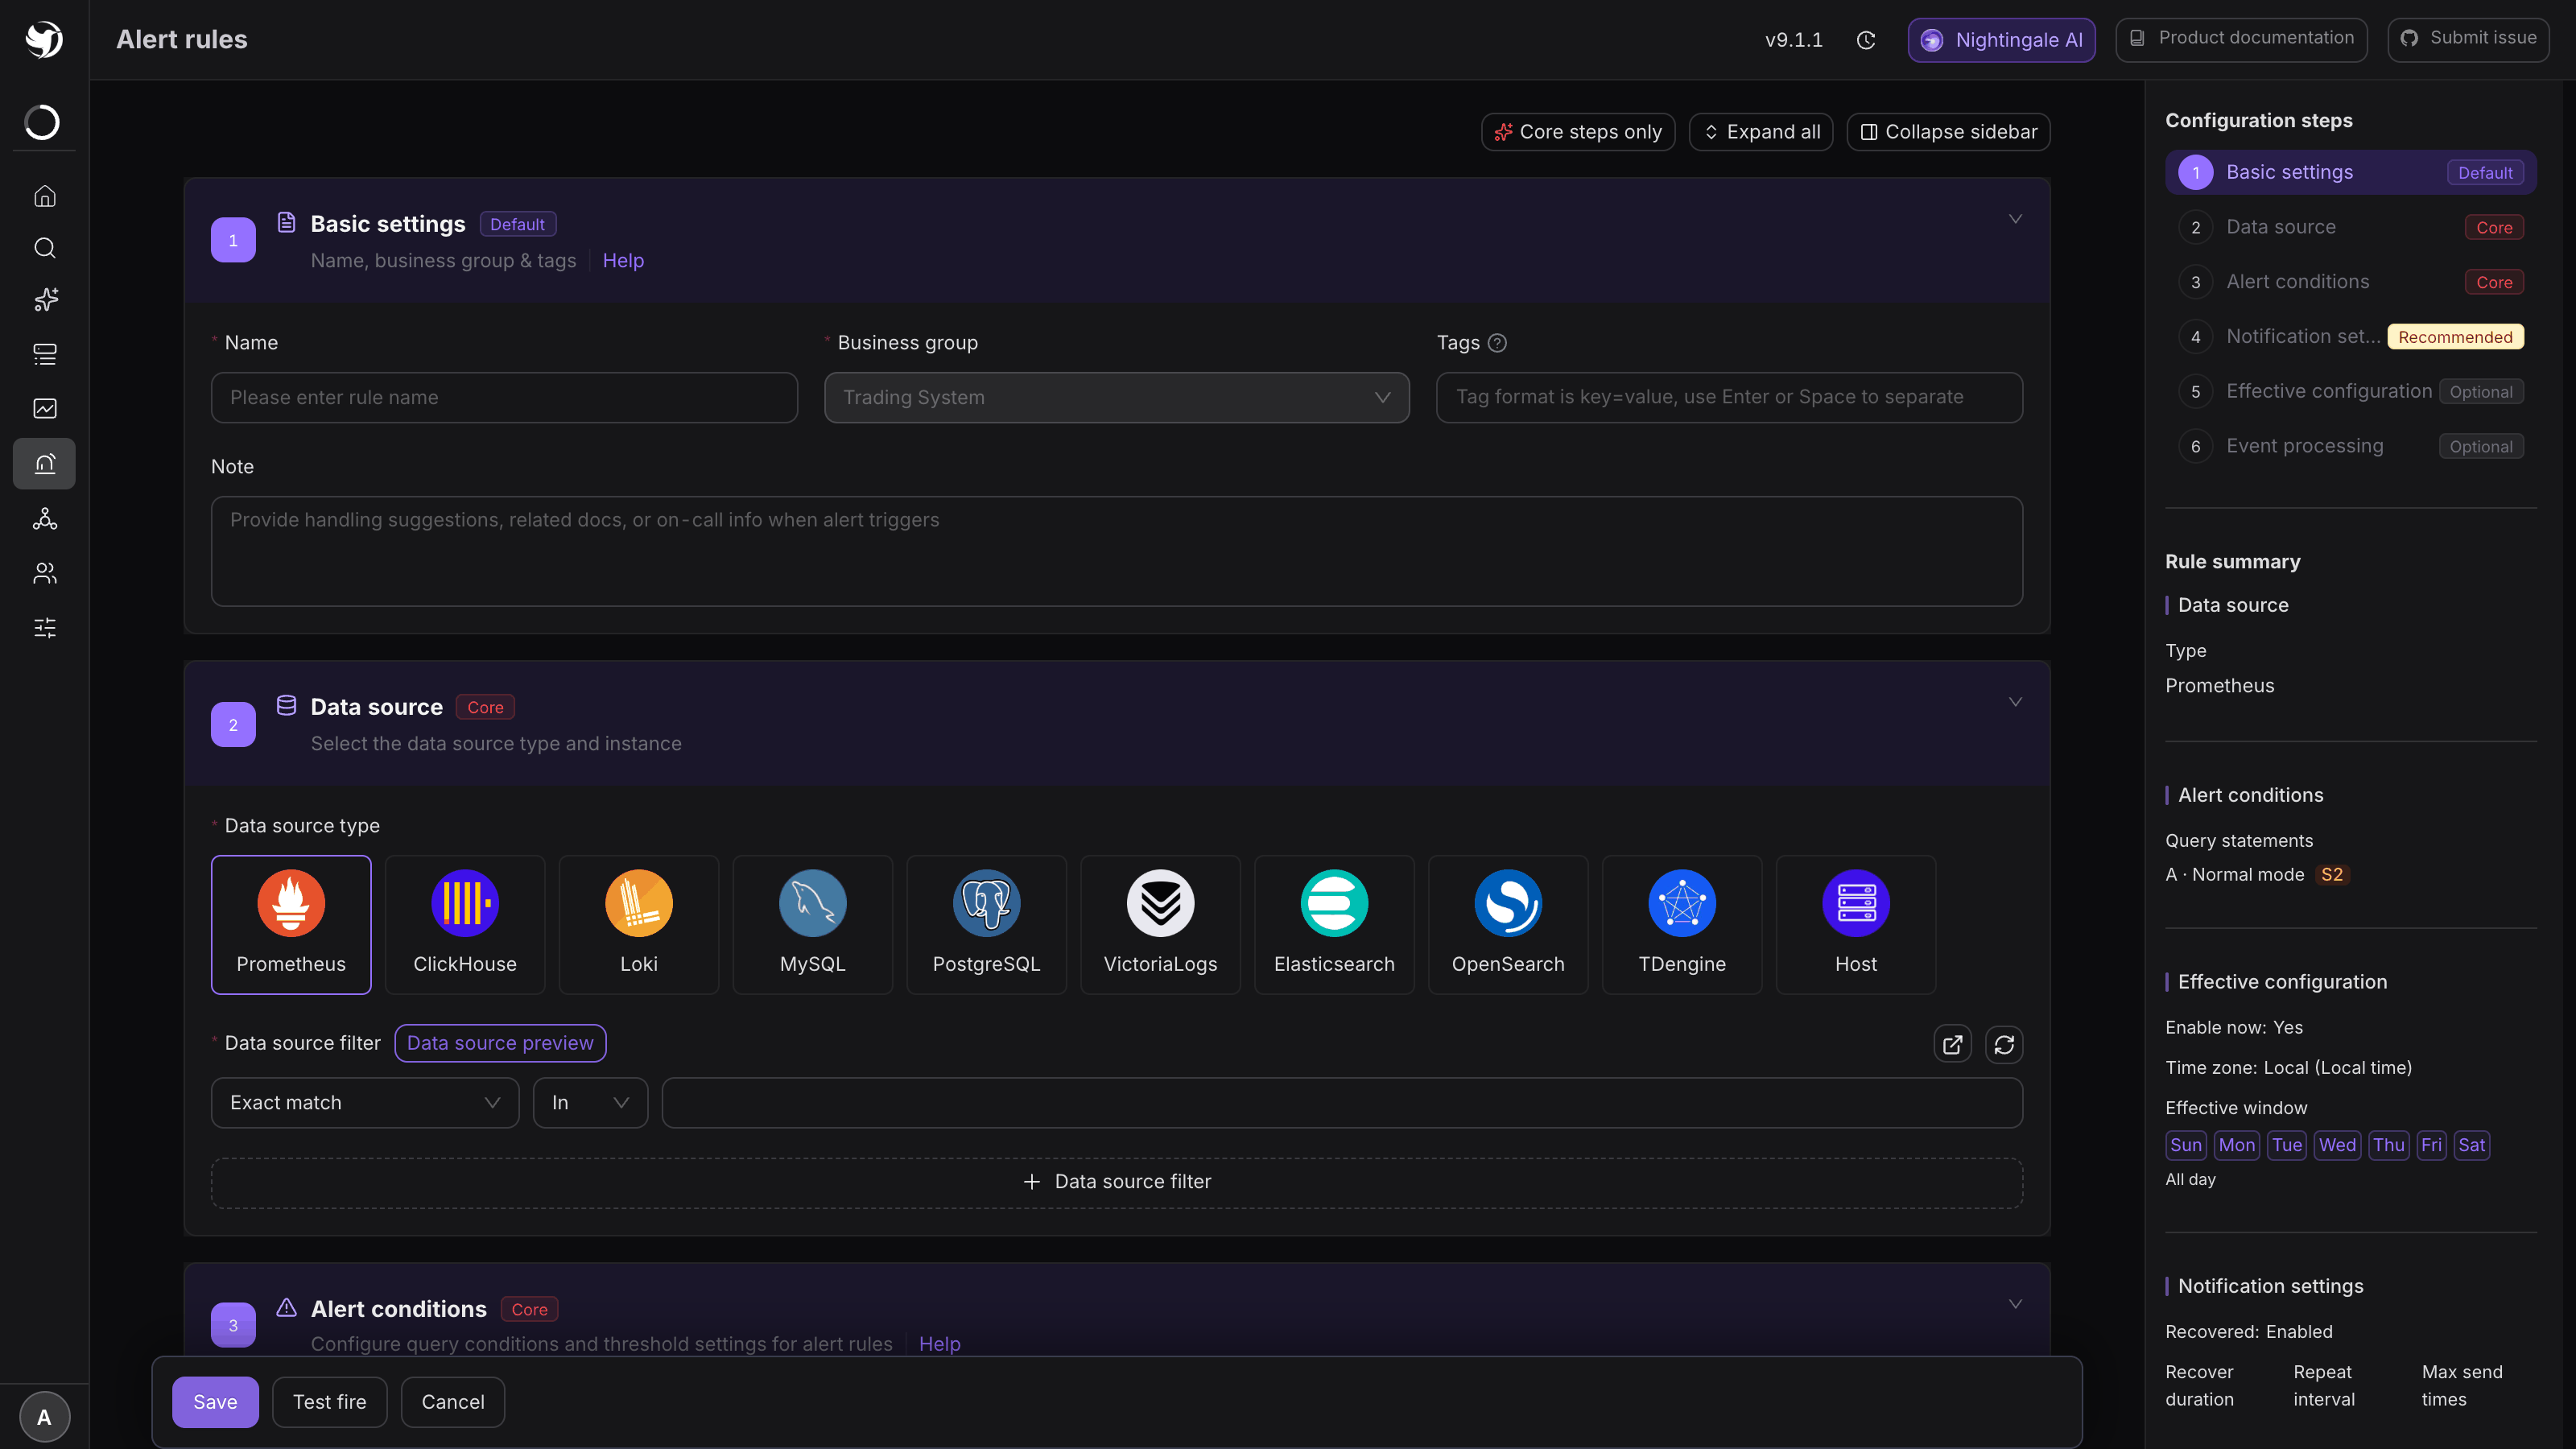
The form is six steps down the middle, with a live Rule summary on the right that fills in as you type. The controls at the top — Core steps only, Expand all, Collapse sidebar — change how much of it is on screen; they change nothing about the rule.
Steps 2 and 3 are marked Core; the rest have working defaults. You will touch four of the six.
2. Name it
Step 1, Basic settings:
| Field | What to put in it |
|---|---|
| Name | First rule test. Plain text — do not put variables in a rule name, or every event gets a different name and none of them group together |
| Business group | Pre-filled from the tree. This decides who can edit the rule and who owns its events |
| Tags | Skip for now. See Labels, annotations and severity |
| Note | Skip |
3. Pick the data source
Step 2, Data source. Click the Prometheus card, then set Data source filter to Exact match / In and choose your source by name.
Only data source types you have registered an instance of appear as cards. An environment with one Prometheus shows fewer cards than the product supports — that is the environment, not a limit.
Leaving the filter on All data sources works too, but then the rule runs once per matching source. For a first rule, pin it to one.
4. Write the condition
Step 3, Alert conditions. There is one query card. Put in an expression that must be true, so you are testing the chain and not your threshold:
target_up == 1
If your metrics come from an external Prometheus rather than Categraf, use up == 1 instead.
Leave severity at S2. Below the query, set:
- Execution frequency:
@every 15s— faster than you would use in production, so you do not have to wait; - For duration (s):
0— fire on the first match.
The threshold lives inside the PromQL. There is no separate threshold box, and the rule produces one event per series the query returns. That is the whole model — Metric rules covers it properly.
Expand Preview on the query card. Expected result: a chart with data. An empty chart means the
rule can never fire, and no amount of configuration further down will help — swap in any metric you
know your source has (up only exists if Prometheus scrapes targets itself) and try again.
5. Attach a notification rule
Step 4, Notification settings → Select notification rule.
A fresh install has none, and a rule with no notification rule produces events that nobody is told about. If the list is empty, either create one now — see Notification rules — or continue without one and watch the event list instead of your inbox. For this first rule, either is fine.
Leave everything else at its defaults: recovery notifications on, repeat every 60 minutes, no send limit.
Skip steps 5 and 6. Their defaults are "always effective" and "no processing".
6. Test fire before saving
Click Test fire at the bottom, next to Save. The rule does not have to be saved first.
In the dialog, leave the severity as-is, event type Trigger, and make sure Dry run is checked — unchecked, it sends a real notification to real people. Click Run test.
Expected result: six stages, each with a status tag. Query & trigger check should say the query returned series with a current value. If it says Query is valid but returned no data, go back to step 4 — that is the whole answer.
The other stages tell you what would happen next: whether a mute rule would catch the event, and whether any notification rule matches. Details in Test fire a rule.
7. Save and watch it fire
Save. Expected result: the rule appears in the list with Enable on.
Within a minute or two, two things happen:
- the Status column on the rule's row turns into a red marker, meaning this rule currently has events. Click it to see them in a side panel;
- Alerts & Notifications → Events shows the events, one per host.
That is the full chain proved: data source → query → evaluation → event.
If nothing appears after two minutes, open Eval records on the rule's row. Every evaluation cycle leaves a record saying what the query returned and what happened to the result — see Inspect evaluation execution records.
8. Now make it a real rule
As written, this rule never stops firing. Do not leave it running.
Either delete it — a rule has to be disabled before it can be deleted — or turn it into something useful:
mem_used_percent > 85
and set the frequency to @every 60s with a for-duration of 180. Three minutes of sustained
memory pressure is worth a message; one spike is not. Evaluation interval and
recovery explains how to pick those numbers.
Next
- Write the query properly: Metric rules
- Alert on logs or a database instead: Log rules, SQL-backed rules
- Import a hundred rules instead of writing them: Rule templates and built-in rules
- Get the event to a person: Notification rules