Inspect evaluation execution records
Every evaluation leaves a record: see what the query returned and why an event did or did not fire.
Where this page ends: for any rule, you can pull up the last hour of evaluations and read, cycle by cycle, what the query returned, which series crossed the threshold, and what happened to each event afterwards. This is the answer to "the query returns data but the rule does not fire".
Open the records
Alerts & Notifications → Alert rules, hover the row of the rule, and click Eval records in the operations column.
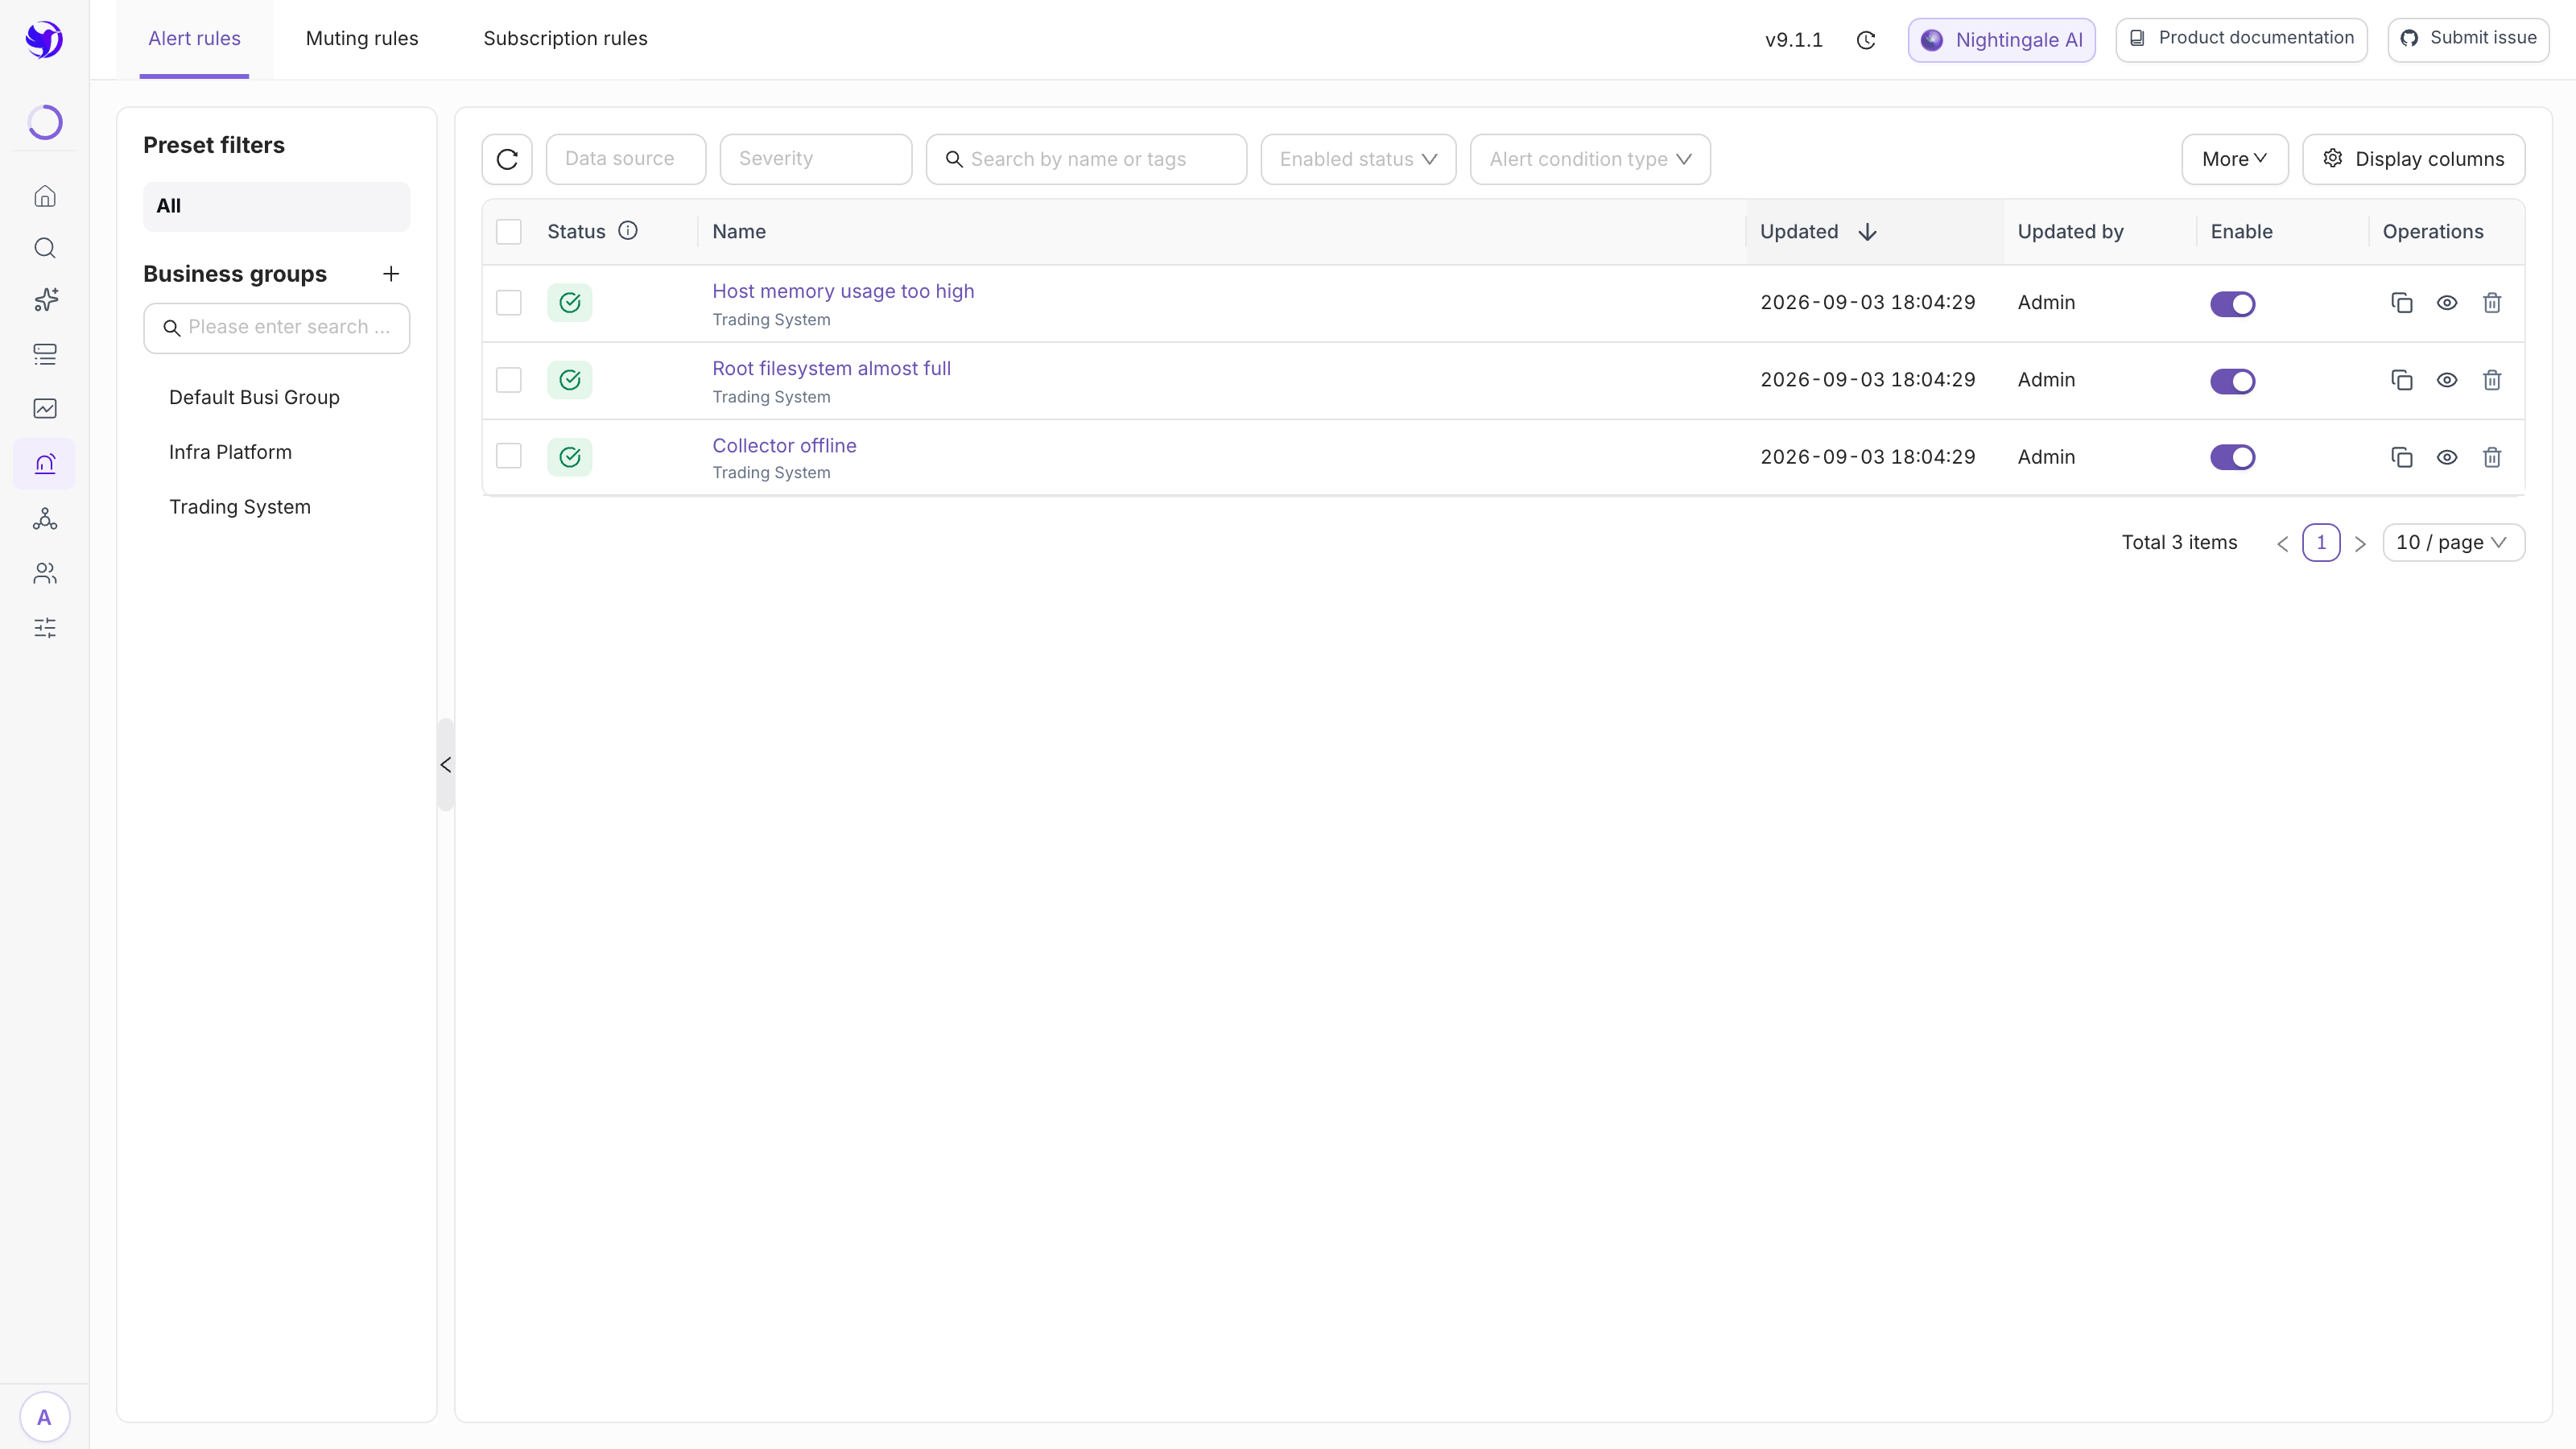
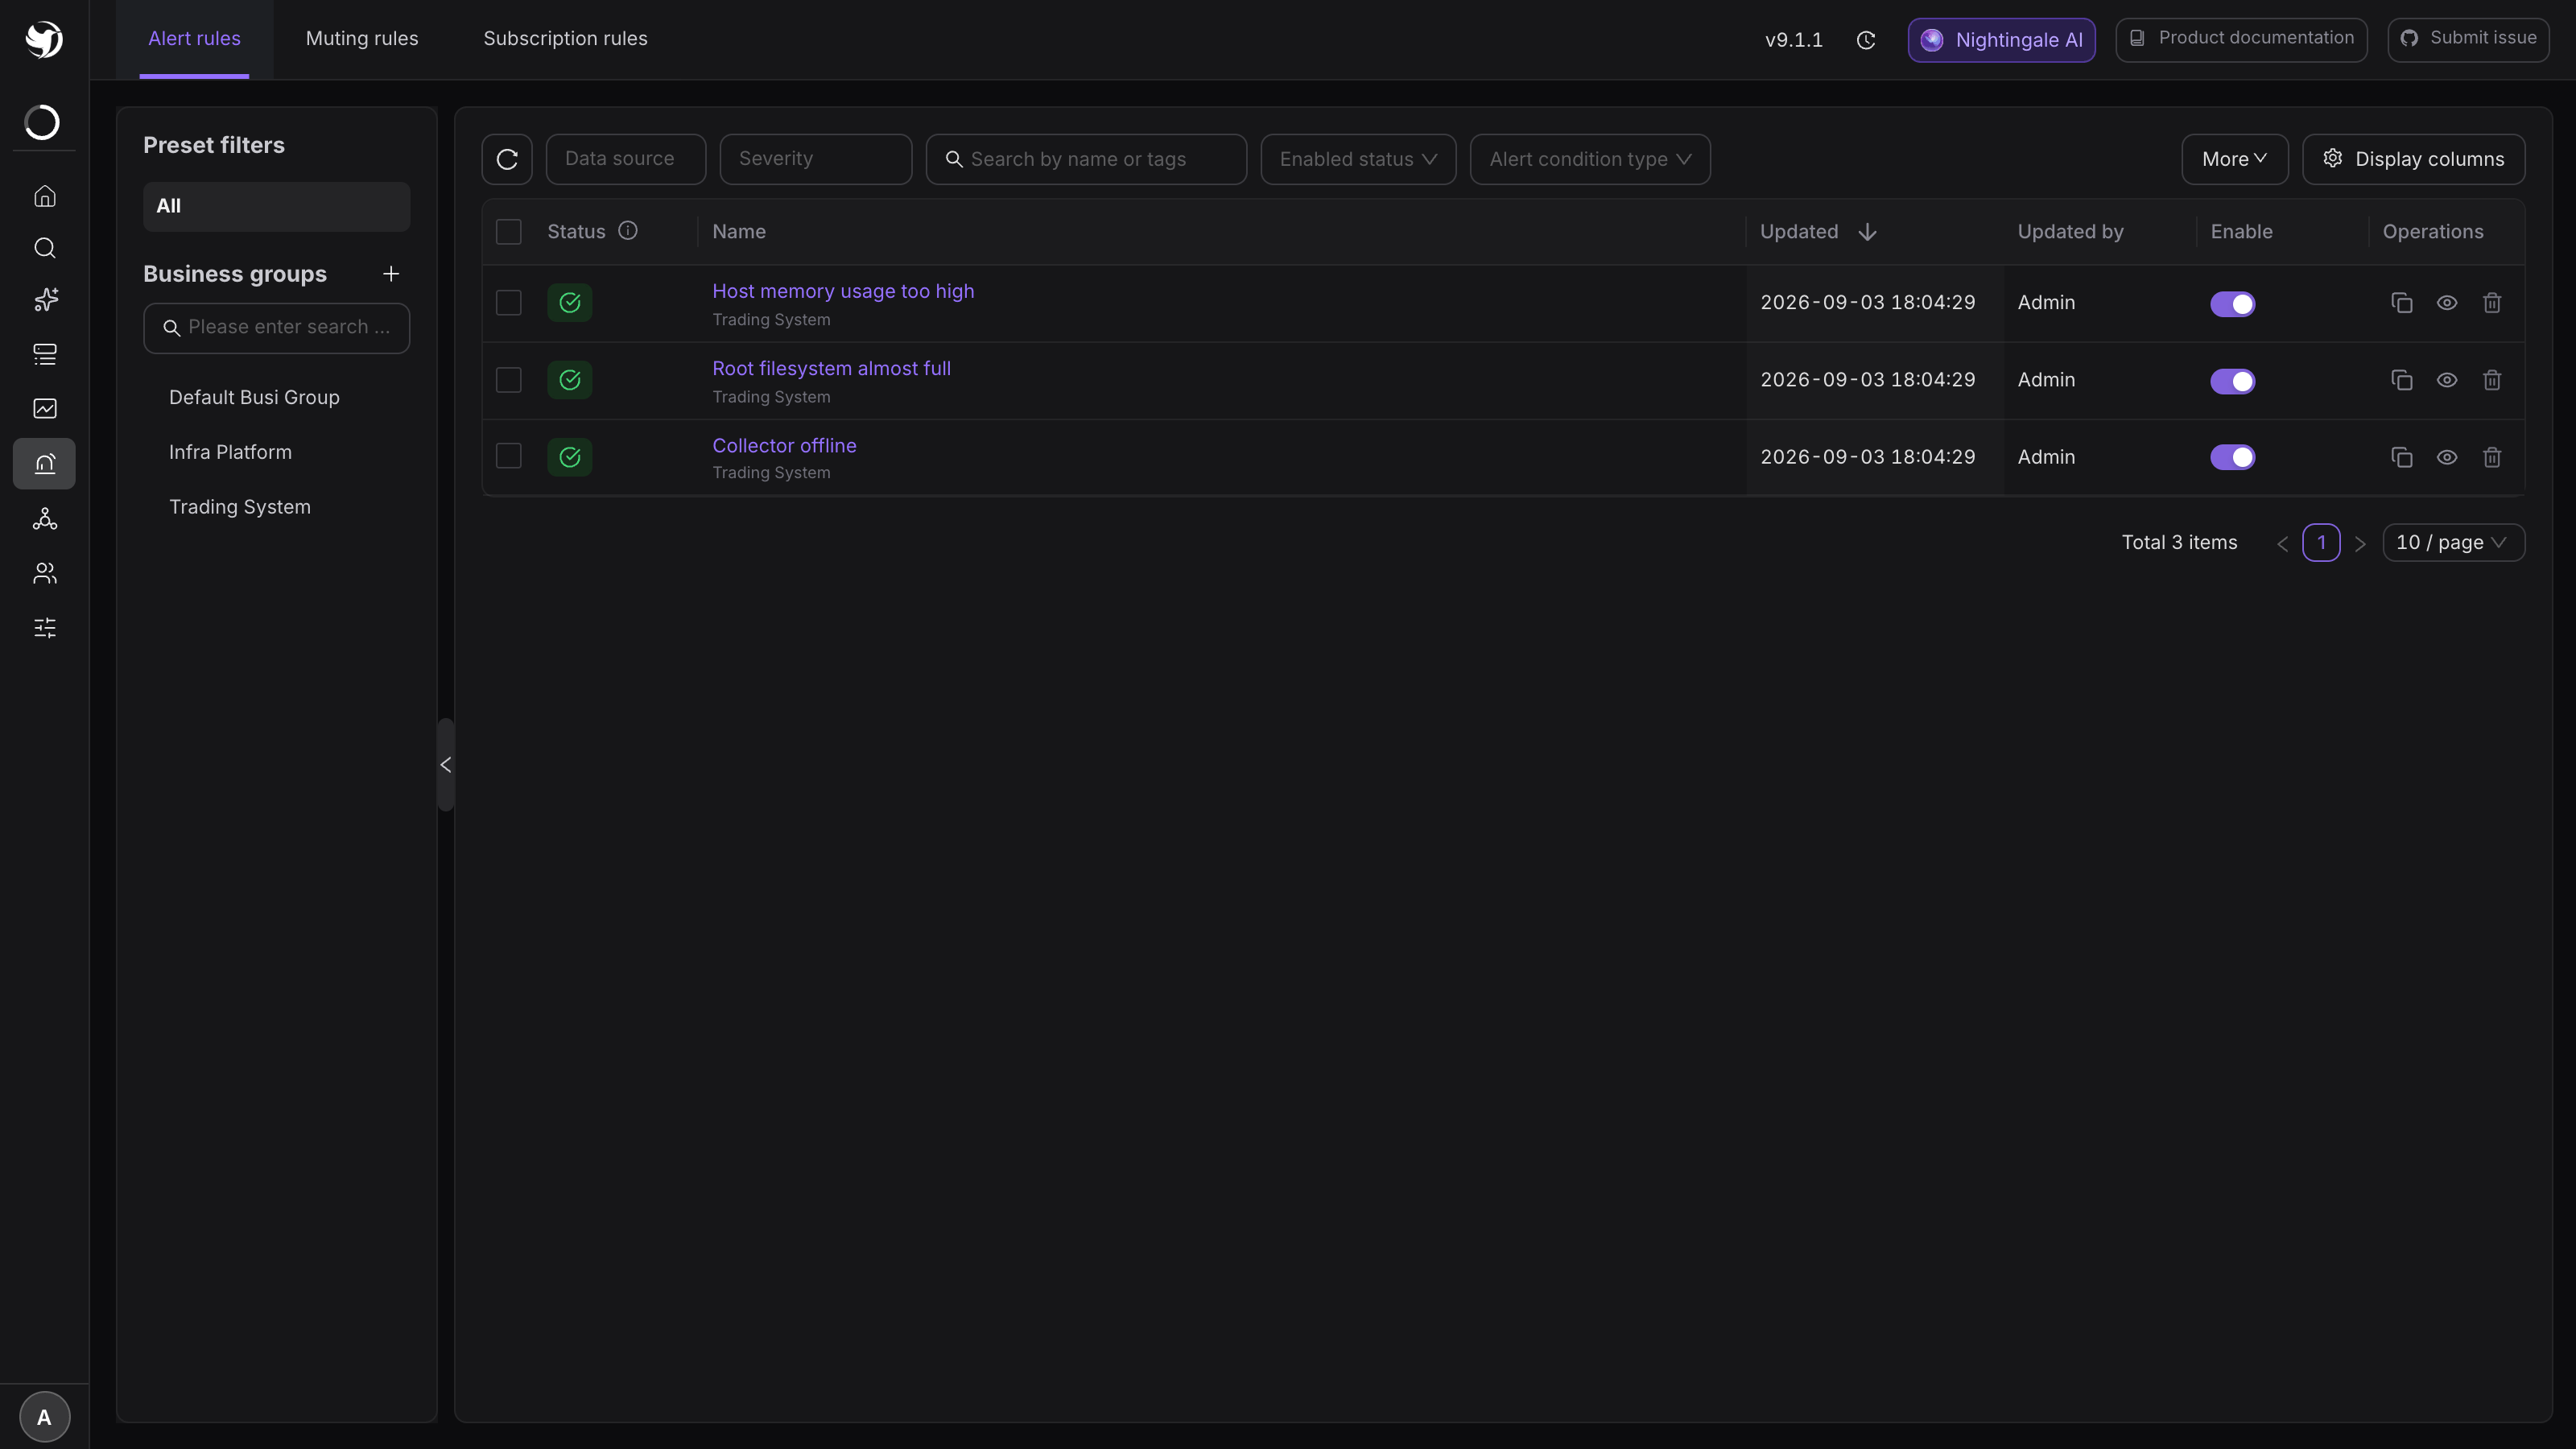
A drawer opens showing the last hour. Change the range with the time picker at the top, and use Load earlier records at the bottom to page backwards.
An empty list is itself information — the last section of this page lists the three reasons.
One row per evaluation cycle
| Column | What it tells you |
|---|---|
| Eval time | When this cycle ran |
| Data source | Only shown when the rule matched more than one source. Each source is evaluated separately and produces its own rows |
| Query results | One tag per query: A: 12 series, or an orange A: No data, or a red A: Query error with the message in the tooltip |
| Anomalies | How many series met the trigger condition this cycle. A green ↓n next to it counts series that recovered |
| Event handling | Where those anomalies ended up: Fired / Pending (for duration) / Muted / Dropped by pipeline / Inhibited |
| Duration | How long the cycle took, in milliseconds. This is the number to watch when a rule falls behind |
Reading left to right answers the question in order: did the query work, did anything cross the threshold, and did an event actually come out of it.
Expand a row for the raw material
Clicking a row expands three sections:
- Queries — the query as it was actually sent (variables already substituted, tagged Variable-expanded query when the rule uses variables), plus the returned series with their labels, values and data timestamps.
- Evaluation results — the series that were judged anomalous, each with its labels and the value that was compared. Recovered series are tagged.
- Event handling details — one line per event: its hash, its labels, the stage it reached and a one-line explanation of the verdict.
The hash is a link only for the stages where the event actually reached the database — Fired, Repeat stalled, Notify muted and Recovered. At every other stage the event was never stored, so there is nothing to open.
Series and points are capped before being written to disk, so a very wide result is truncated and the record says so.
The stages an event can reach
The stage on each line in Event handling details is the exact point where the engine stopped carrying that event forward:
| Stage | Meaning |
|---|---|
| Pending (for) | The condition is true but has not held for the for-duration yet. The detail line reads for=300s elapsed=120s |
| Fired | Produced and queued — first trigger or a repeat notification |
| Repeat stalled | Already firing, and the repeat interval has not elapsed, so nothing is sent this cycle |
| Inhibited | A higher severity in the same rule matched the same series, and inhibit is on |
| Dropped by pipeline | An event pipeline attached to the rule discarded it |
| Muted | A mute rule matched, so no event was produced at all |
| Notify-only muted | A mute rule matched that suppresses only notifications; the event was still stored |
| Notify muted | A stored snapshot taken while notifications are muted |
| Muted by hook | An external mute policy matched |
| Recovered | The recovery event was produced and queued |
| Enqueue failed | The event queue was full — the engine is behind, not the rule |
The order matters and it is not the order people assume: the pipeline runs before mute rules. An event dropped by a pipeline never reaches the mute check.
Three questions it answers directly
"The query works in the explorer but the rule never fires." Look at Query results. If the tag
says No data, the rule's query is not what you pasted into the explorer — most often it is running
against a different data source, or a variable expanded to something you did not expect. Expand the
row to see the query as sent.
"It fired but nobody was notified." Look at the Event handling column. Muted and
Dropped by pipeline mean the event never reached notification. Fired means it did, and the
problem is downstream in the notification rules —
see No notification arrives.
"It fires and recovers over and over." Compare the Anomalies count across consecutive rows.
A count that flips between 1 and 0 every cycle is a metric sitting on the threshold —
see Alert fires repeatedly or never recovers.
Where records live, and how long
Records are written to the local disk of the alerting engine that ran the evaluation, not to
the database. Defaults, all under [Alert.EvalLog] in the engine config:
[Alert.EvalLog]
# Disable = false
# defaults to <[Log] Dir>/evallog
# Dir = "logs/evallog"
# 192 hours = 8 days
# RetentionHours = 192
# MaxSeriesPerQuery = 100
# MaxPointsPerSeries = 60
# PerRuleDailyMB = 1024
# MaxDiskGB = 20
So: eight days of history, at most 100 series per query and 60 points per series kept per record, capped at 1 GB per rule per day and 20 GB in total. When the caps bite, the newest records win and the older ones are dropped.
Nothing here at all
Three causes, in the order worth checking:
- the range you picked is older than
RetentionHours; Disable = trueis set on this engine;- the rule is evaluated by an engine older than the version that added this feature.
Some engine nodes did not answer
When a rule spans data sources handled by different engines — an edge site, for instance — the drawer shows a warning listing the nodes it could not reach. Their records still exist, on those nodes' own disks. The warning prints the exact command to run there:
curl -u <user>:<pass> 'http://<engine-instance>/v1/n9e/eval-records?rule_id=<id>&datasource_id=<id>&from=<ts>&to=<ts>'
The credentials are the BasicAuth account configured under HTTP.APIForService on that node.
Next
- Fire a rule on purpose instead of waiting: Test fire a rule
- The timing parameters these records reflect: Evaluation interval and recovery
- Follow the event past the engine: Inspect workflow execution records