Inspect workflow execution records
Execution records trace each event through every processor: what each one changed, whether the event was dropped, and where it was sent.
Where this page ends: you can answer whether a given event entered a workflow, what each processor did to it, and whether it was dropped halfway through.
Entry point: Alerts & Notifications → Workflows, then the Execution history tab
(/event-pipelines-executions). Opening executions from a single workflow's row is the same
table with that workflow pre-filtered.
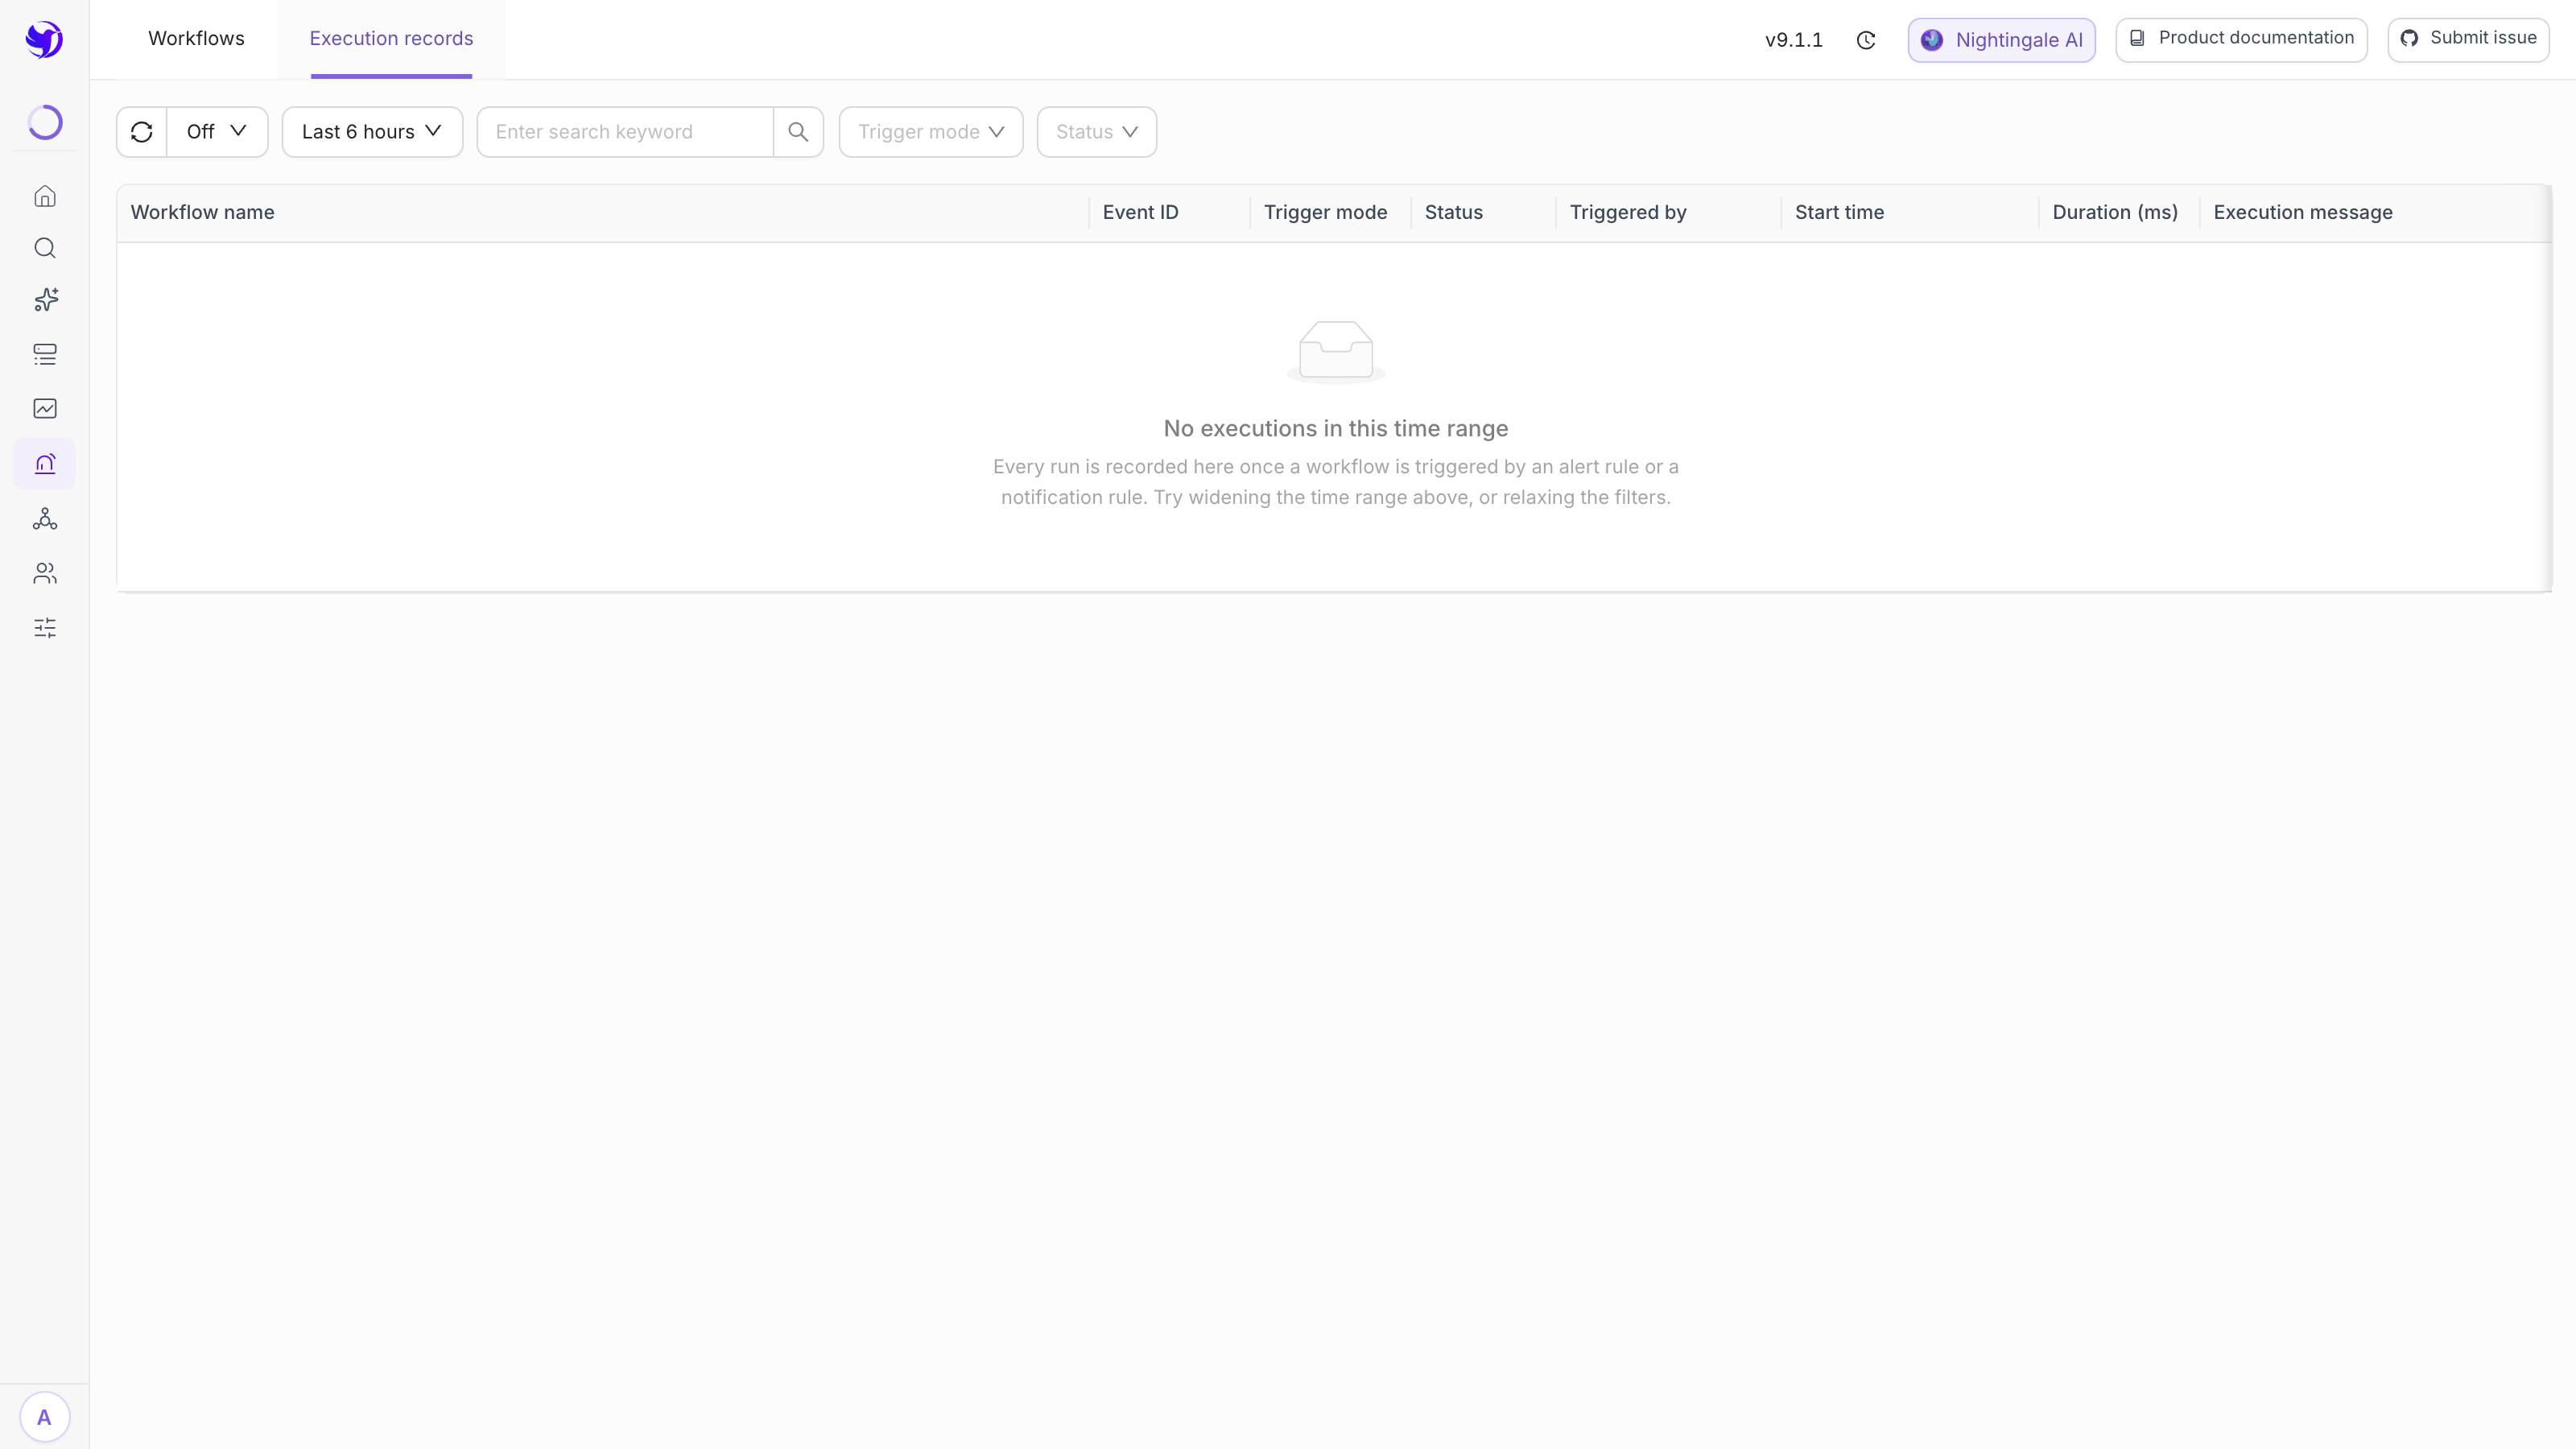
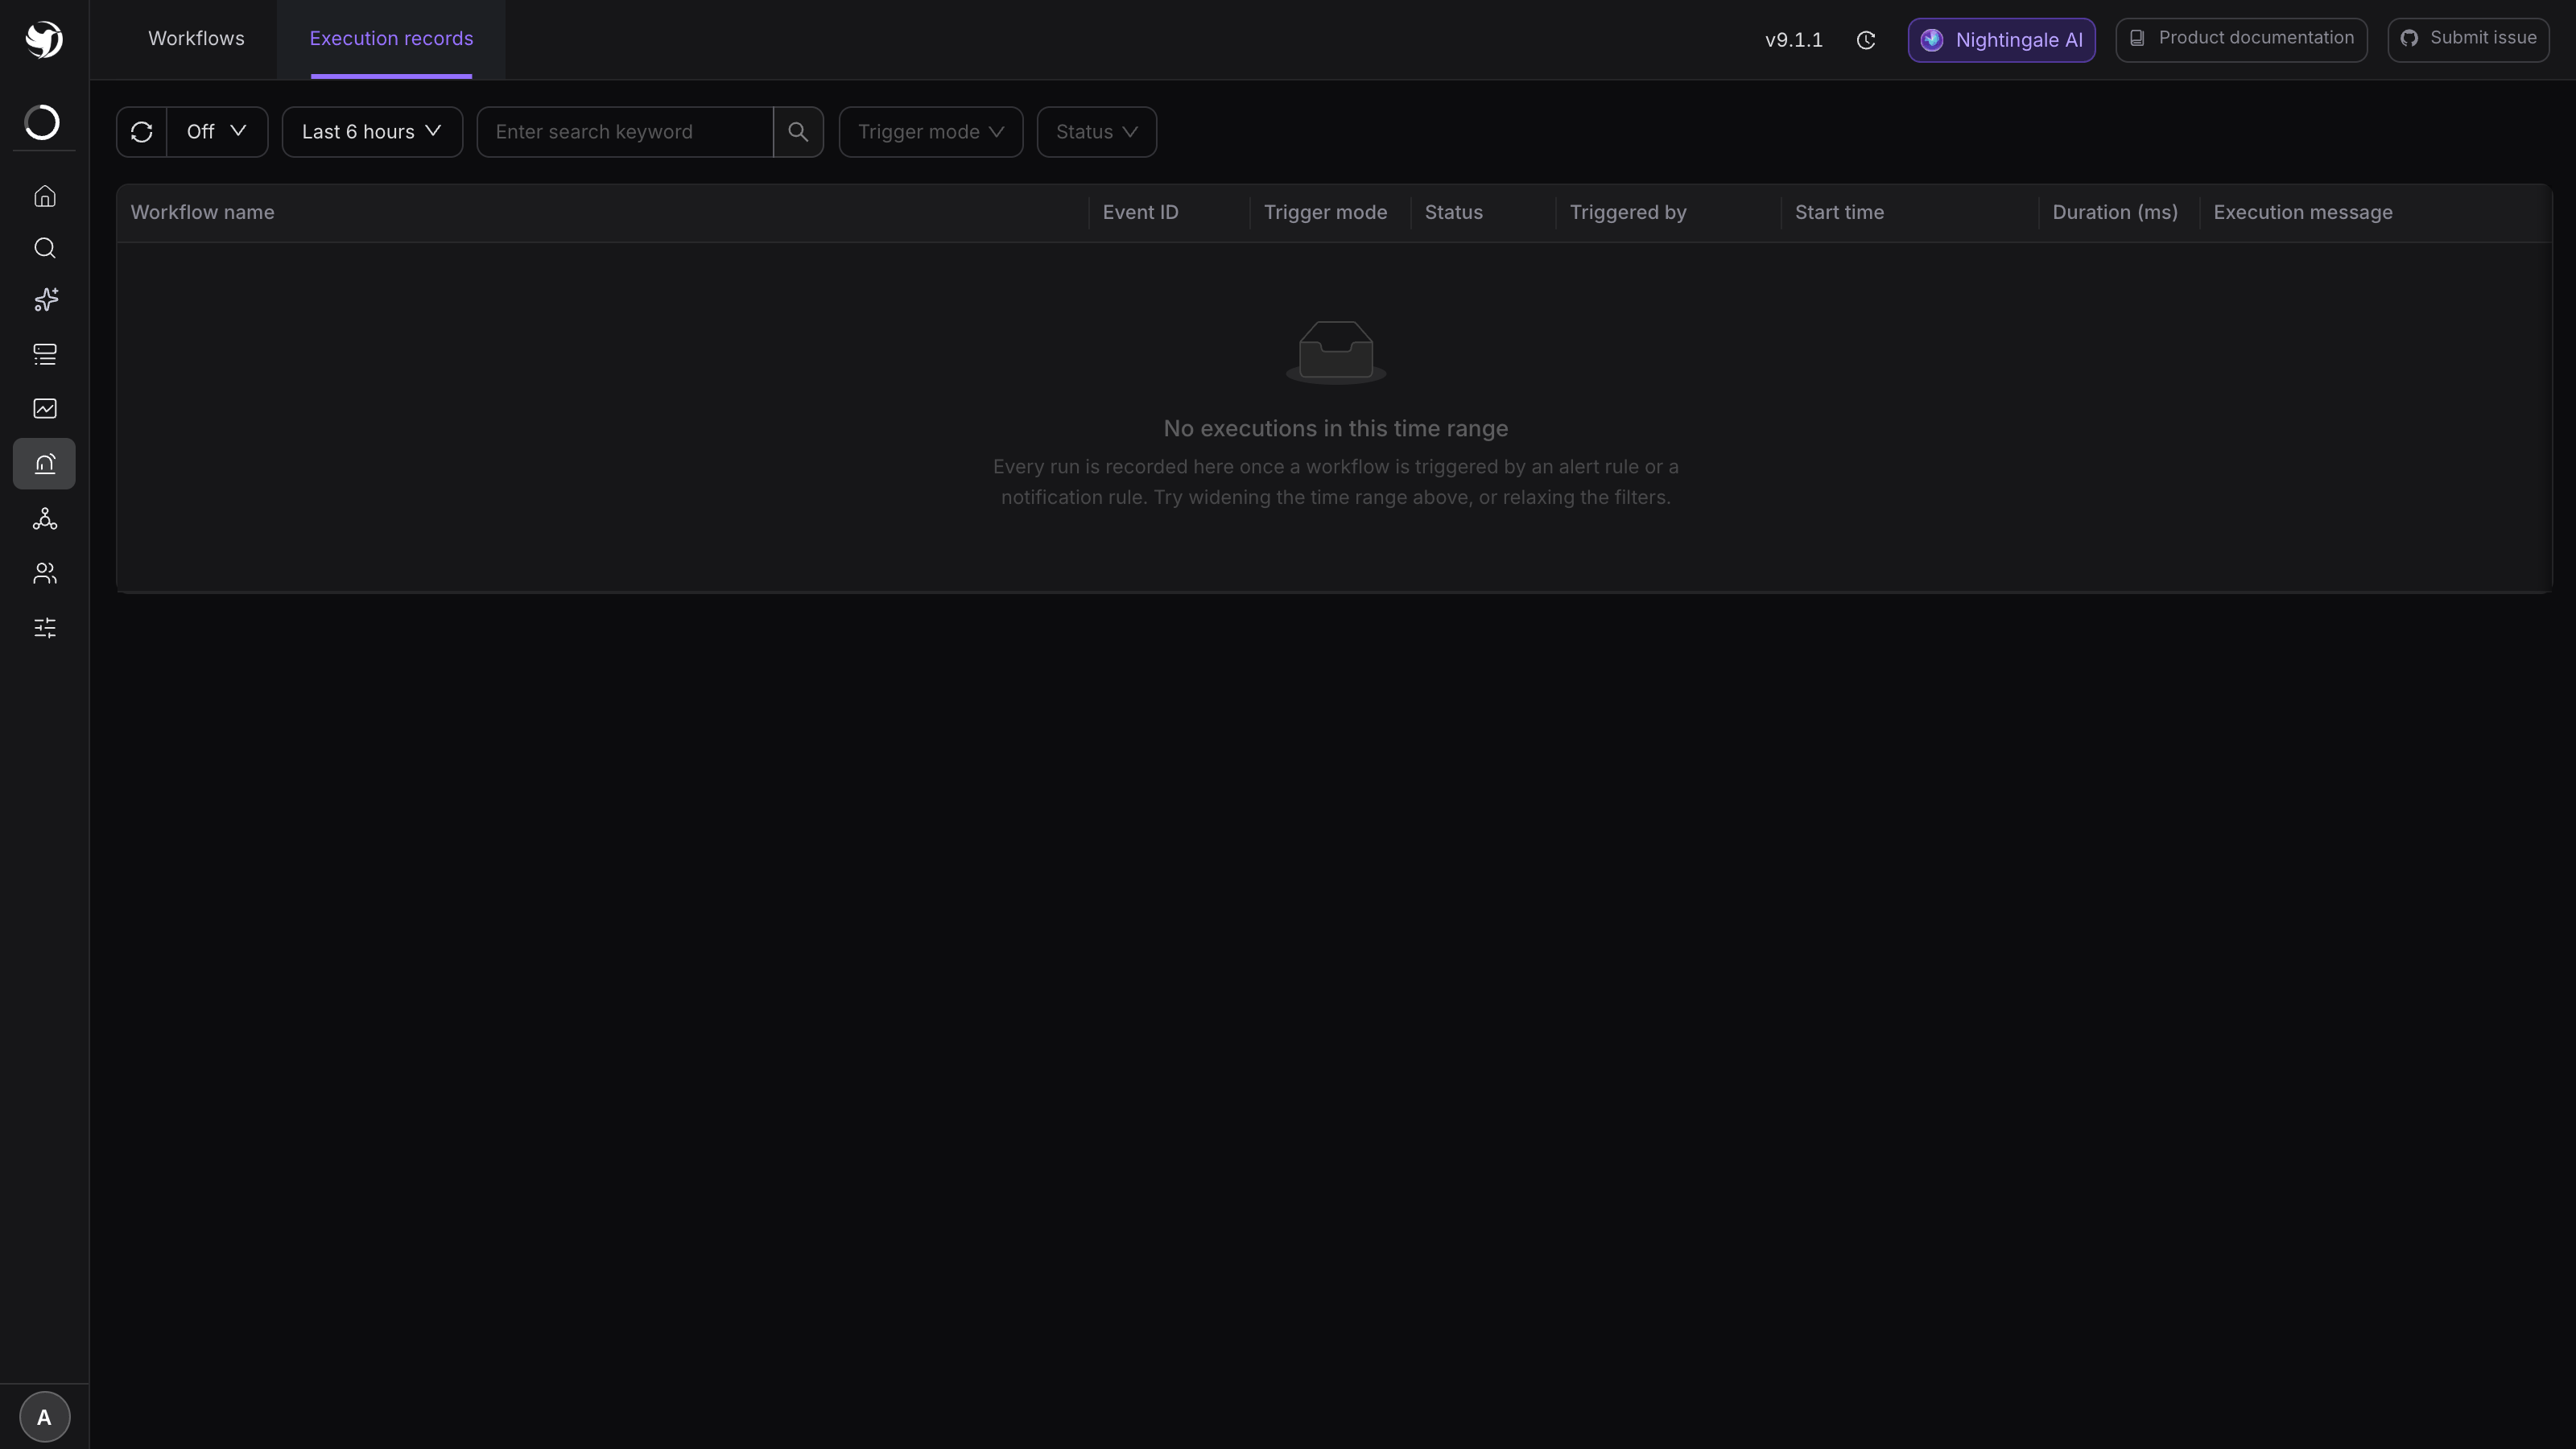
Widen the time range first
The default is the last 6 hours. When nothing shows up, widen the range before concluding the workflow is not running — the empty state says as much.
Three more filters in the toolbar: a keyword search, Trigger mode and Status.
Reading the columns
| Column | How to read it |
|---|---|
| Workflow name | The name at execution time; renaming the workflow later does not rewrite old records |
| Event ID | The alert event this run was about; blank for runs with no event behind them |
| Trigger mode | Event trigger (the live path) or API trigger (test runs and API calls) |
| Status | Running / Success / Failed |
| Triggered by | Alert rule #id or Notification rule #id for event triggers, which tells you the attachment point at a glance; the username for API triggers |
| Start time | When this run began |
| Duration (ms) | Sub-millisecond runs show 0 — a real value, not a missing one |
| Execution message | A neutral description of the outcome, not necessarily an error |
A non-empty execution message does not mean failure. When an event is dropped the status is
still Success and the message reads workflow terminated at node X — the workflow ended
exactly as configured. Only Failed rows render the message in red.
Opening one record
Clicking a row opens the detail drawer:
- Basic information: execution id, workflow, event id, trigger mode, start and end, duration;
- Node execution results: one step per processor — the most useful part;
- Failed node / Error message: present only for failures, naming the processor it stopped at;
- Input variables snapshot: the variable values this run used (stored redacted), for working out why behaviour differs between environments.
Node messages vary by processor type:
- Event drop: "Condition matched — the event was dropped", or "Condition not matched — the event continues downstream". The second is the most common and perfectly normal outcome;
- Event label rewrite: a before/after diff of the labels, or "no change";
- Webhook callback / Event update: what the external endpoint returned.
There are no node results after the node that dropped the event — later processors never ran.
Three problems this diagnoses
- "The workflow does nothing": check whether there are records at all. None means events are not entering it — usually the Scope labels or attributes do not match, or no rule references the workflow.
- "I rewrote a label but the notification is unchanged": find that event's record and read the label-rewrite diff. If the diff is right and the message is not, the problem is the template — see Message templates.
- "The event just vanished": search its event id and see whether an event-drop processor ate
it. The status will be Success, with
terminated at nodein the message.
Where records come from, and how long they stay
- Every run triggered by a real event, from either attachment point, writes a record;
- A whole-workflow test run also writes one, with trigger mode API and your username as the trigger;
- A single-processor test run writes nothing — it does not go through the workflow engine.
Records are cleaned up automatically: a daily 06:00 job deletes anything older than
[Center] CleanPipelineExecutionDay, in batches of 100 to spare the database. The key ships
commented out and the fallback is 7 days, so leaving it alone gives you a week of history, not
forever. There is also an admin-only cleanup endpoint with no UI entry point. On an instance where
workflows run often, include this table's growth in
Capacity planning.
Next
- Validate before going live: Try a workflow with a mock event
- How the workflow itself is configured: Event pipelines
- Tests fine but does nothing live: A workflow tests fine but does nothing in production