Active and historical events
Active events hold alerts that have not recovered; on recovery they move to history. Both lists are searchable by label, severity and business group, in bulk.
Where this page ends: you know which of the two tables an alert is in and why, and how to pull the handful you care about out of several hundred while on call.
Entry point: Alerts & Notifications → Events, with two tabs at the top — Active alerts and Historical alerts.
How the two lists differ
Active /alert-cur-events | Historical /alert-his-events | |
|---|---|---|
| Holds | Events still firing, not yet recovered | Every event ever produced, recovered included |
| How long a row stays | Disappears the moment it recovers | Kept until you clean it up |
| Default time filter | Unlimited (including one burning for weeks) | Last 6 hours |
| What you can do | Mute, delete, share | Search, export, clean up |
When an event recovers, the row in Active disappears and a Recovered row shows up in
Historical — the row is not moved; the two tables have always been separate stores.
An event's identity is rule + label set
One rule running against 5 hosts produces 5 independent events, because their label sets
differ (ident is not the same). Each fires, recovers and notifies on its own. Seeing the same
rule name on 5 rows is normal, not duplication.
An event's business group comes from the rule's business group, not the host's. If "My business groups / All business groups" does not surface an event you expect, check which business group owns the rule.
Finding the one you want
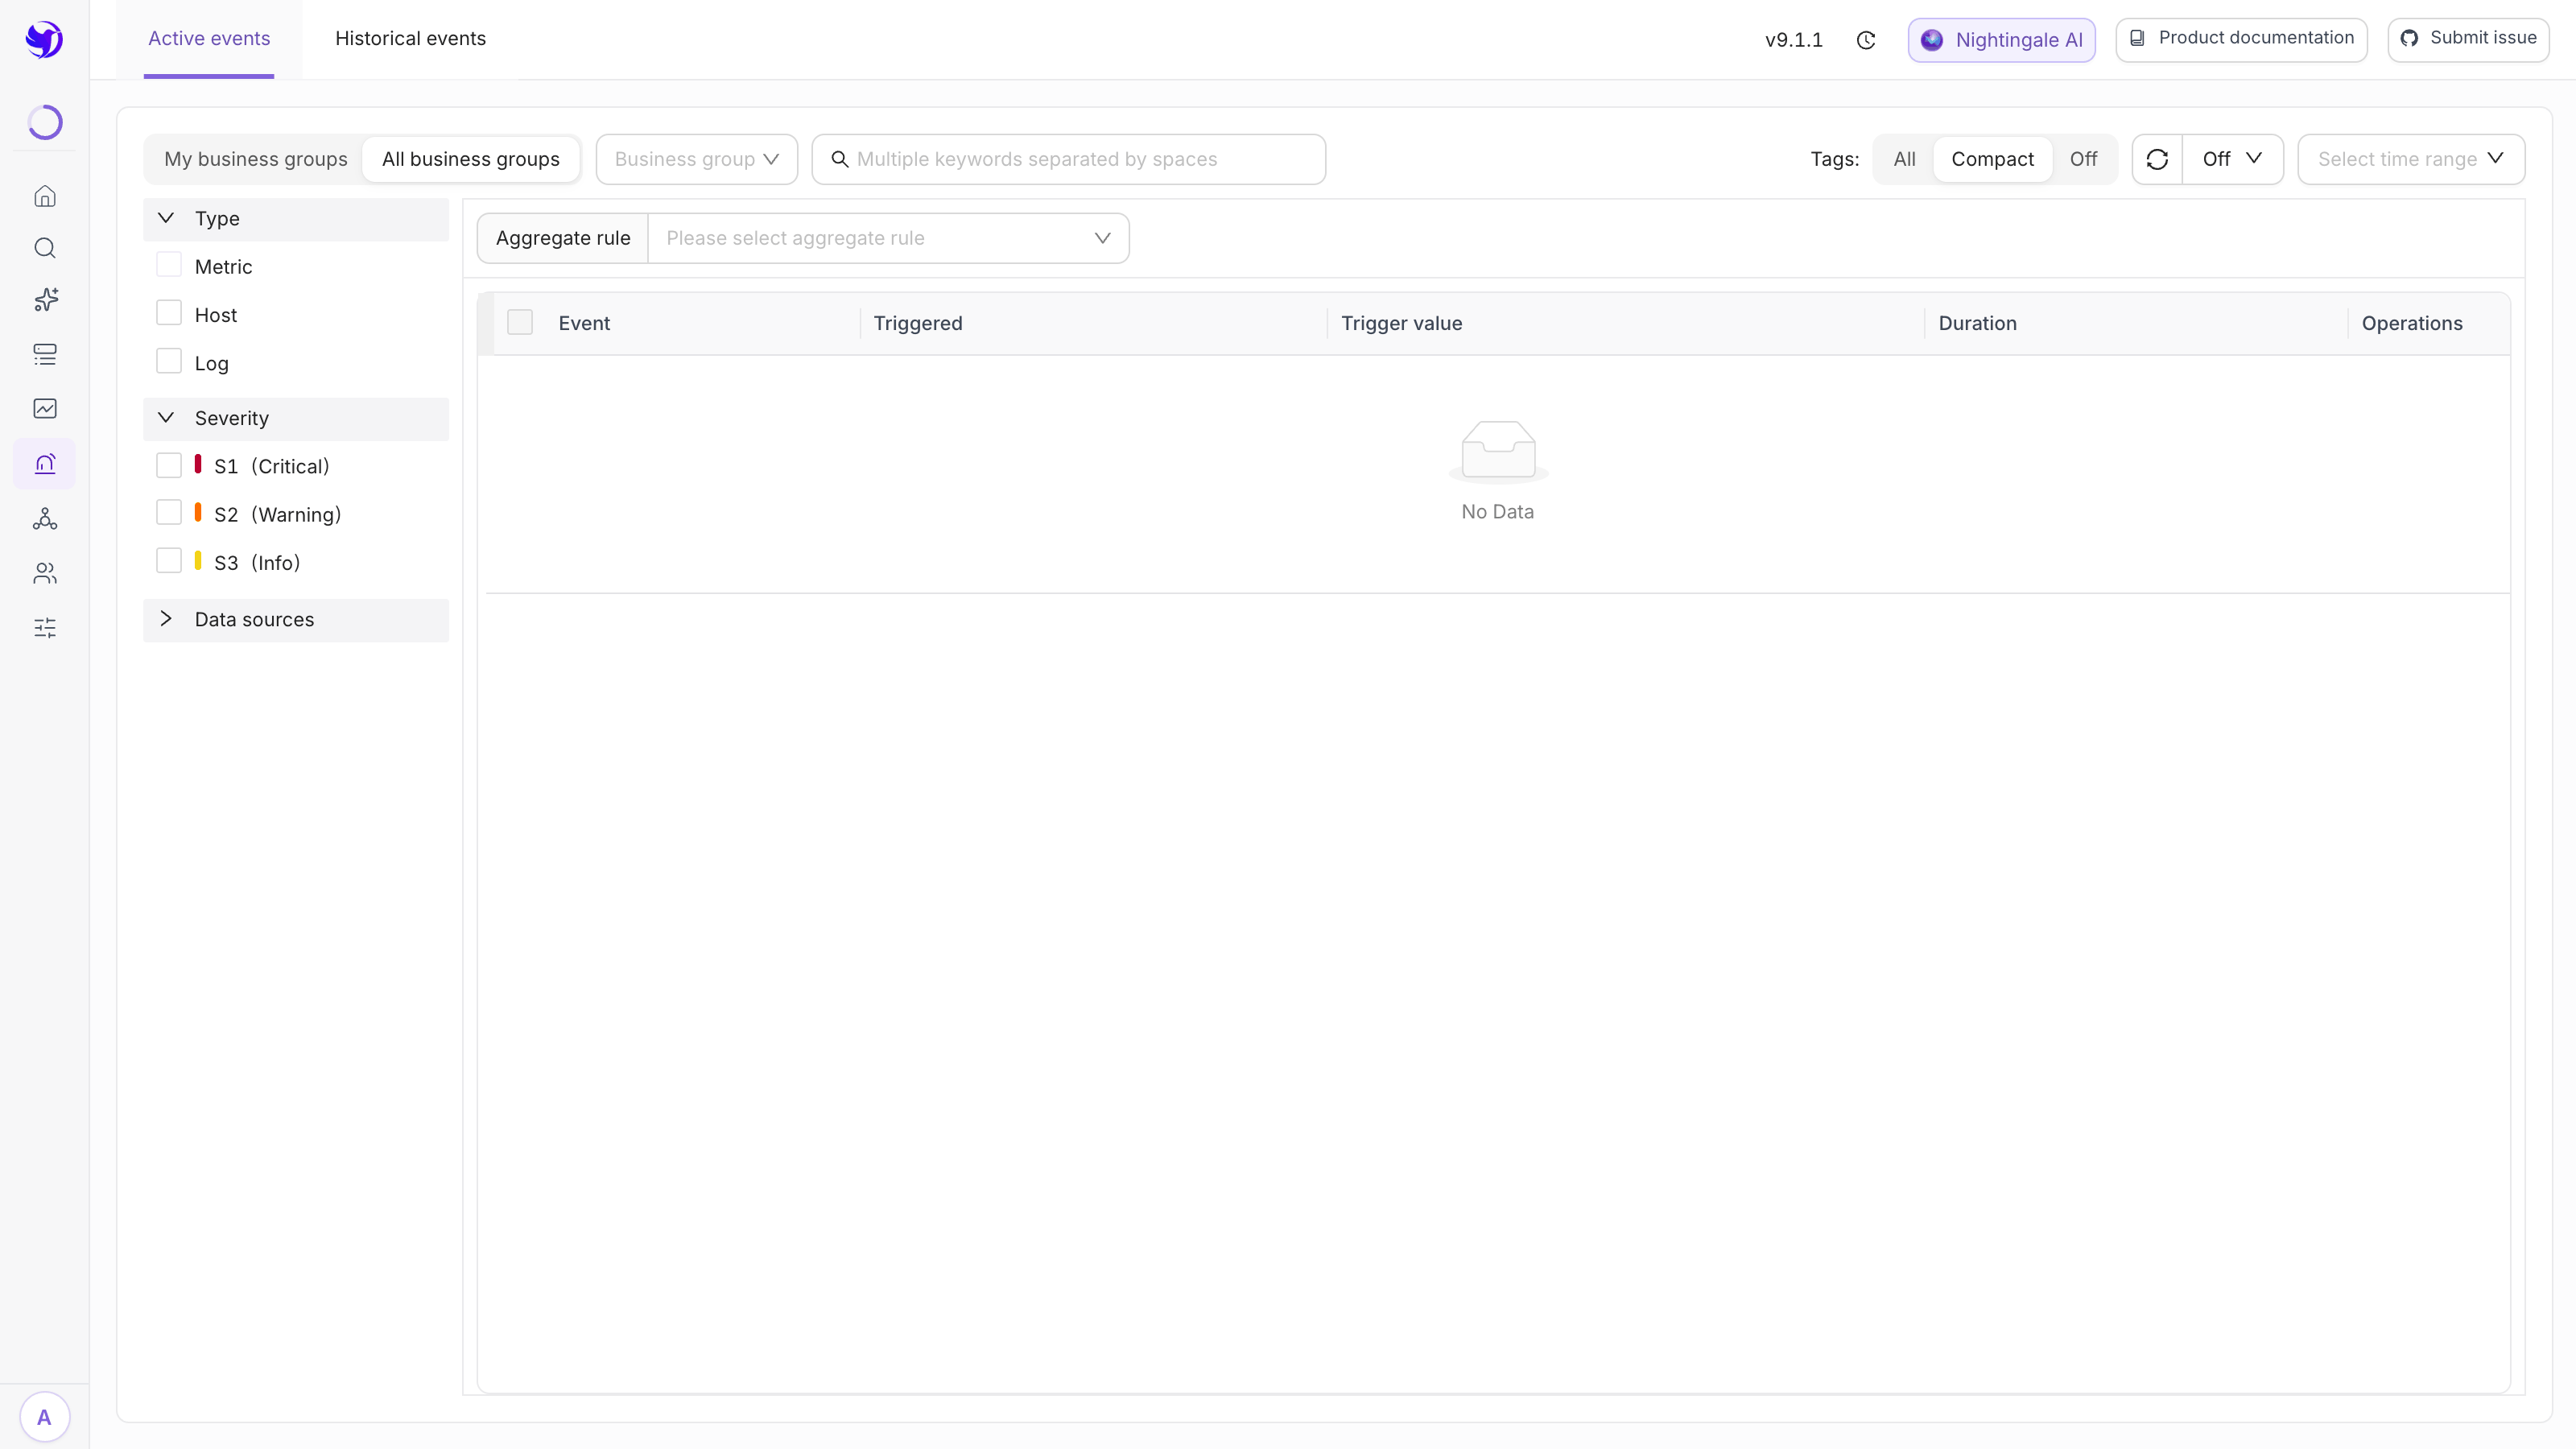
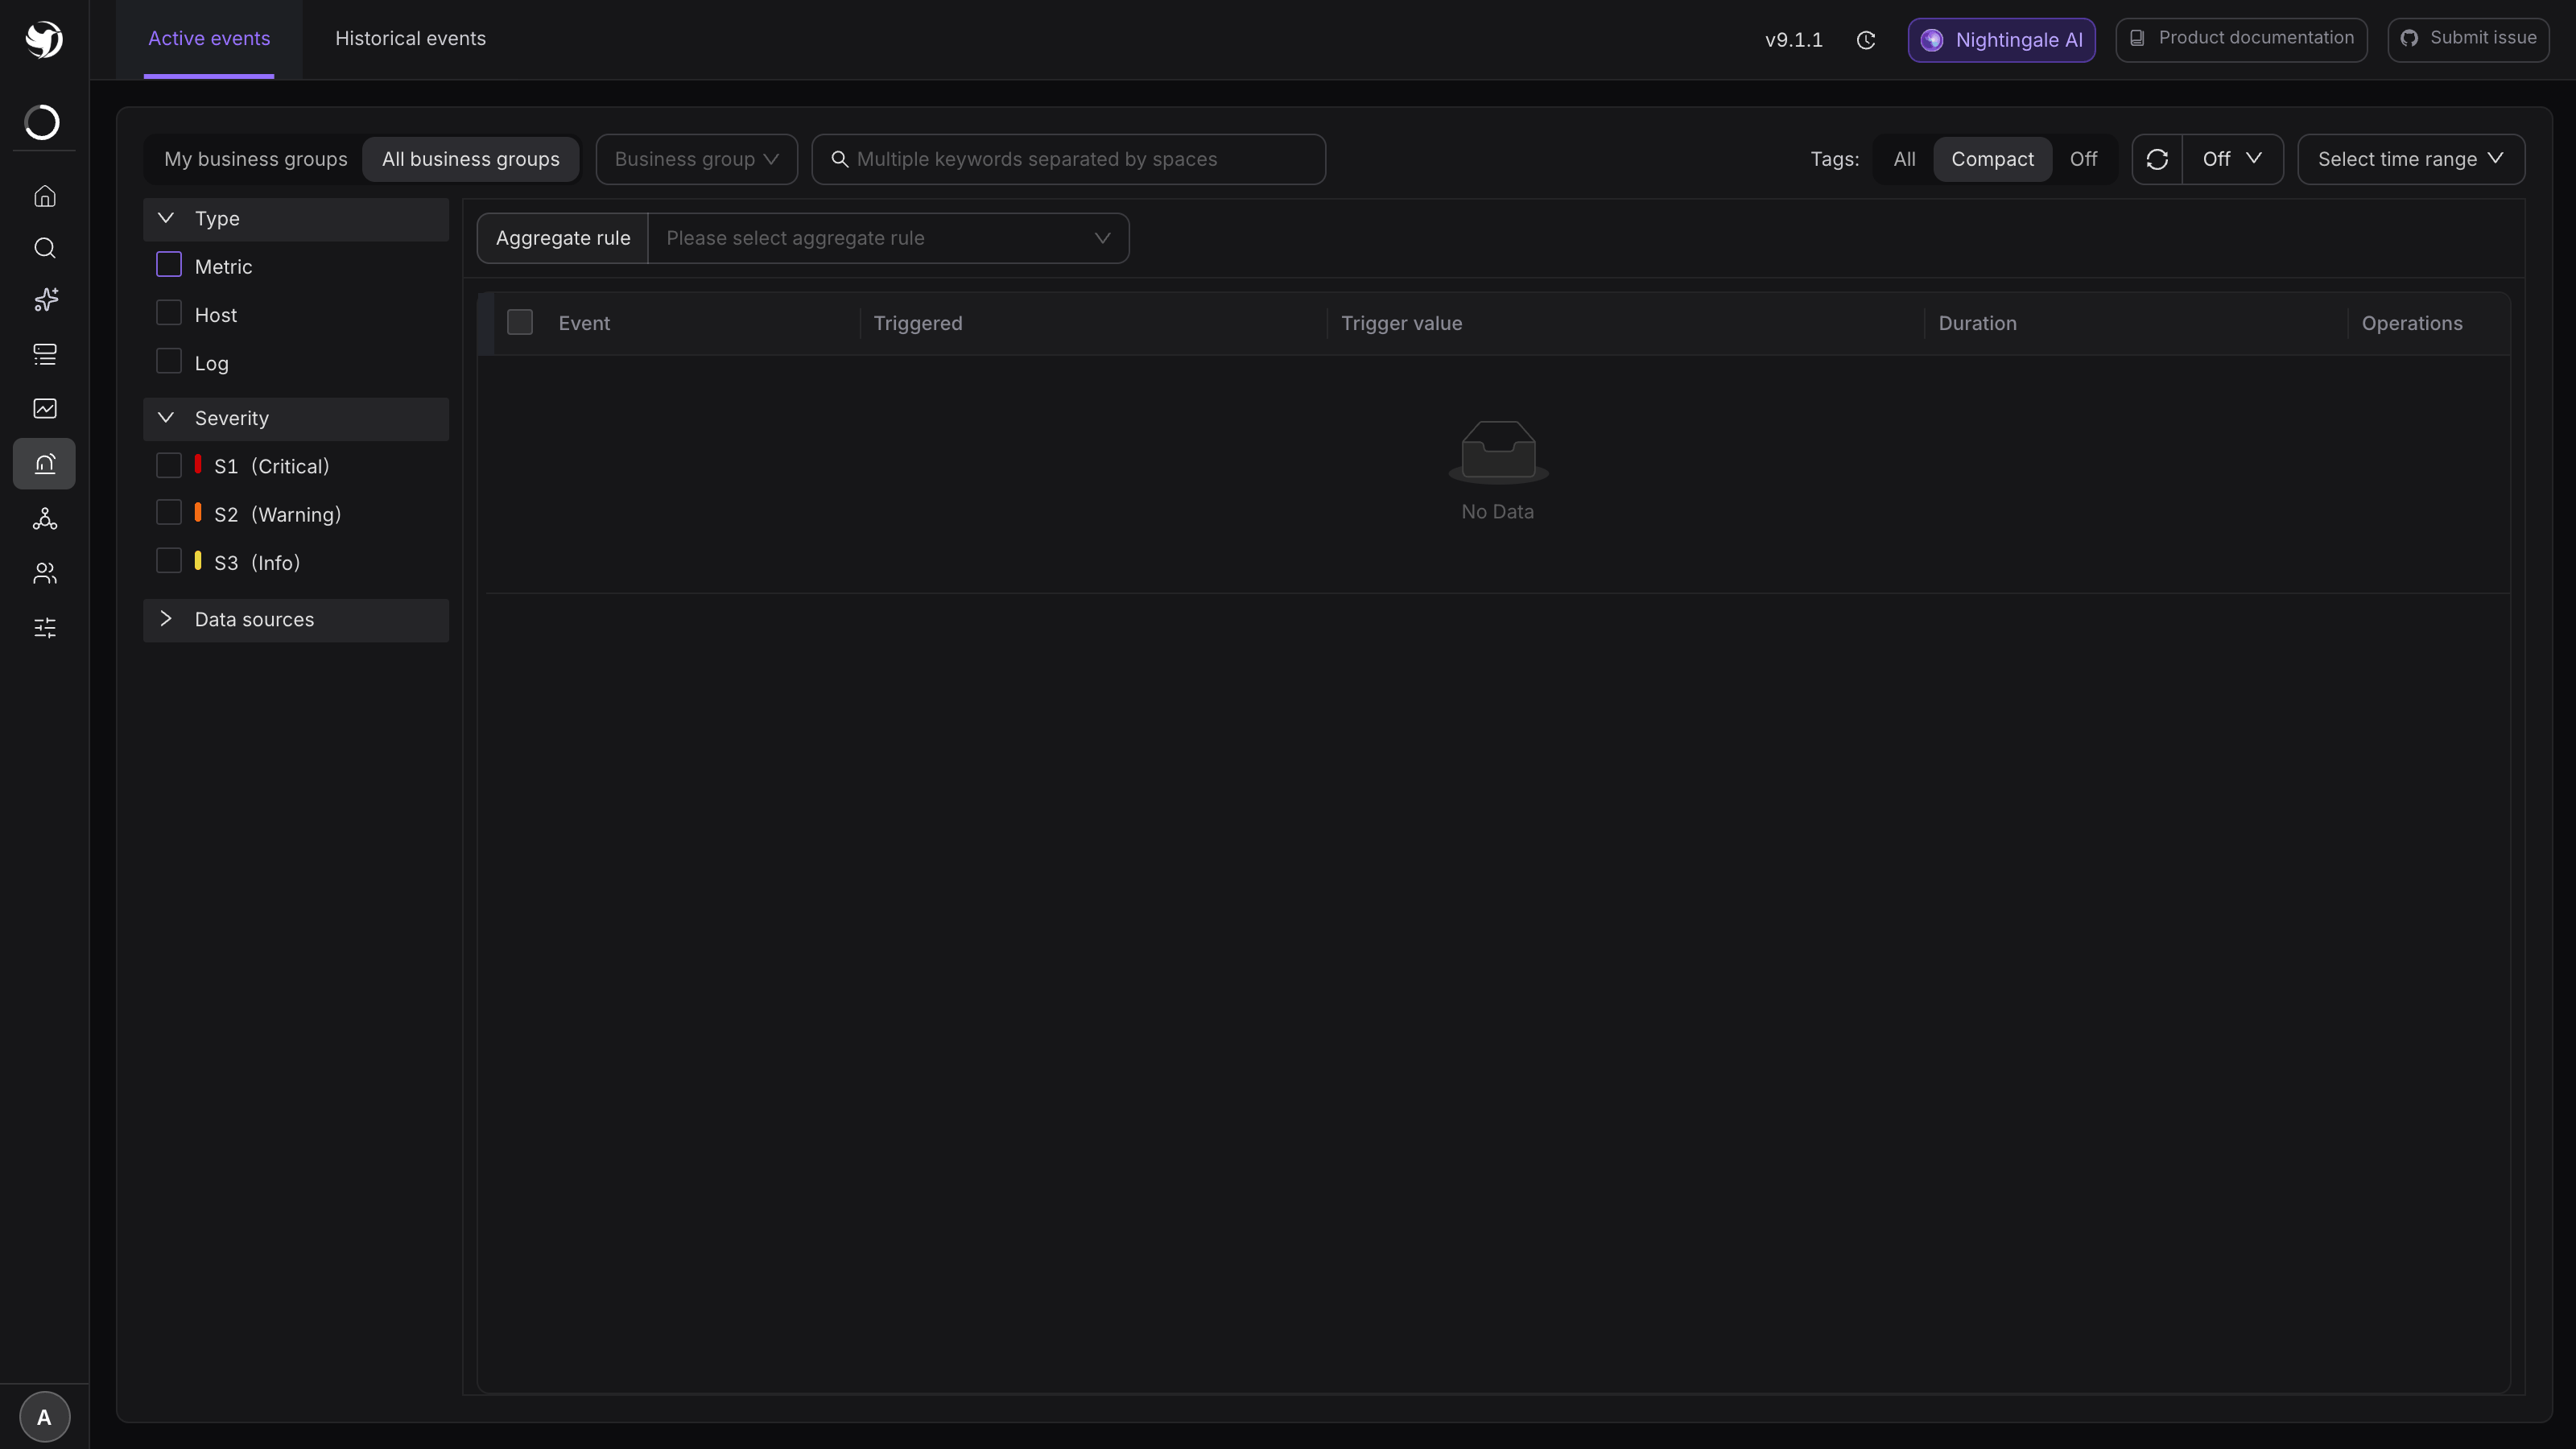
The top row:
- My business groups / All business groups plus the group dropdown next to it — two levels of narrowing;
- Fuzzy search covers rule names and labels at once. Several keywords separated by spaces
are AND-ed:
disk n9e-web-01matches events whose rule name contains disk and whose labels contain n9e-web-01; - Tag display: All / Compact / Off. Compact saves the most room on a wall display;
- Auto refresh: Off by default, 5s through 5min available.
The left panel has three multi-select groups: Type (Metric / Host / Log), Severity (S1 Critical / S2 Warning / S3 Info) and Data source. The three groups are AND-ed.
Each row has a coloured bar on the left for severity, and the bar under Duration shifts green to red with age, so the longest-burning event is visible at a glance.
When there are still too many rows, fold them into cards with the Aggregate rule selector above the table — see Event aggregation and deduplication.
What to look at inside one event
Clicking the event title (the blue line) slides a detail panel in from the right. Beyond rule name, severity, labels, first trigger time and trigger value, three things are worth going to directly:
- The query: the PromQL / SQL the rule actually ran, with a button next to it to re-run it. This is how you tell "the data really is abnormal" from "the threshold is wrong";
- Notification records: which media types this event was pushed to, whether they succeeded, and what a failure returned. Start here when nothing arrives, then follow Alert event exists but no notification arrives;
- Hash: the event fingerprint, computed from rule plus labels. Copy and compare it when working out why two rows are treated as the same event.
Three buttons at the bottom:
- Mute: pre-fills a mute rule with this event's labels and jumps to the new-mute form. This is the most-used way to stop the noise — see Mute rules;
- Delete: physically removes the event. Only when you are sure the metric will never be reported again (host decommissioned, label renamed) — such events can never recover. In every other case let it recover by itself;
- Sharing link: issues a read-only link that needs no login, 7 days by default, for a colleague to look at. Same mechanism as Anonymous time-limited sharing, applied to one event.
Handling several at once
Tick multiple rows and a batch bar appears above the list. The open-source edition can batch delete.
Deleting is not muting: the rule is still enabled, so if the condition still holds on the next evaluation a fresh event is produced (possibly with the same hash). To stop the noise for longer, use Mute rules or disable the rule.
Historical events: export and cleanup
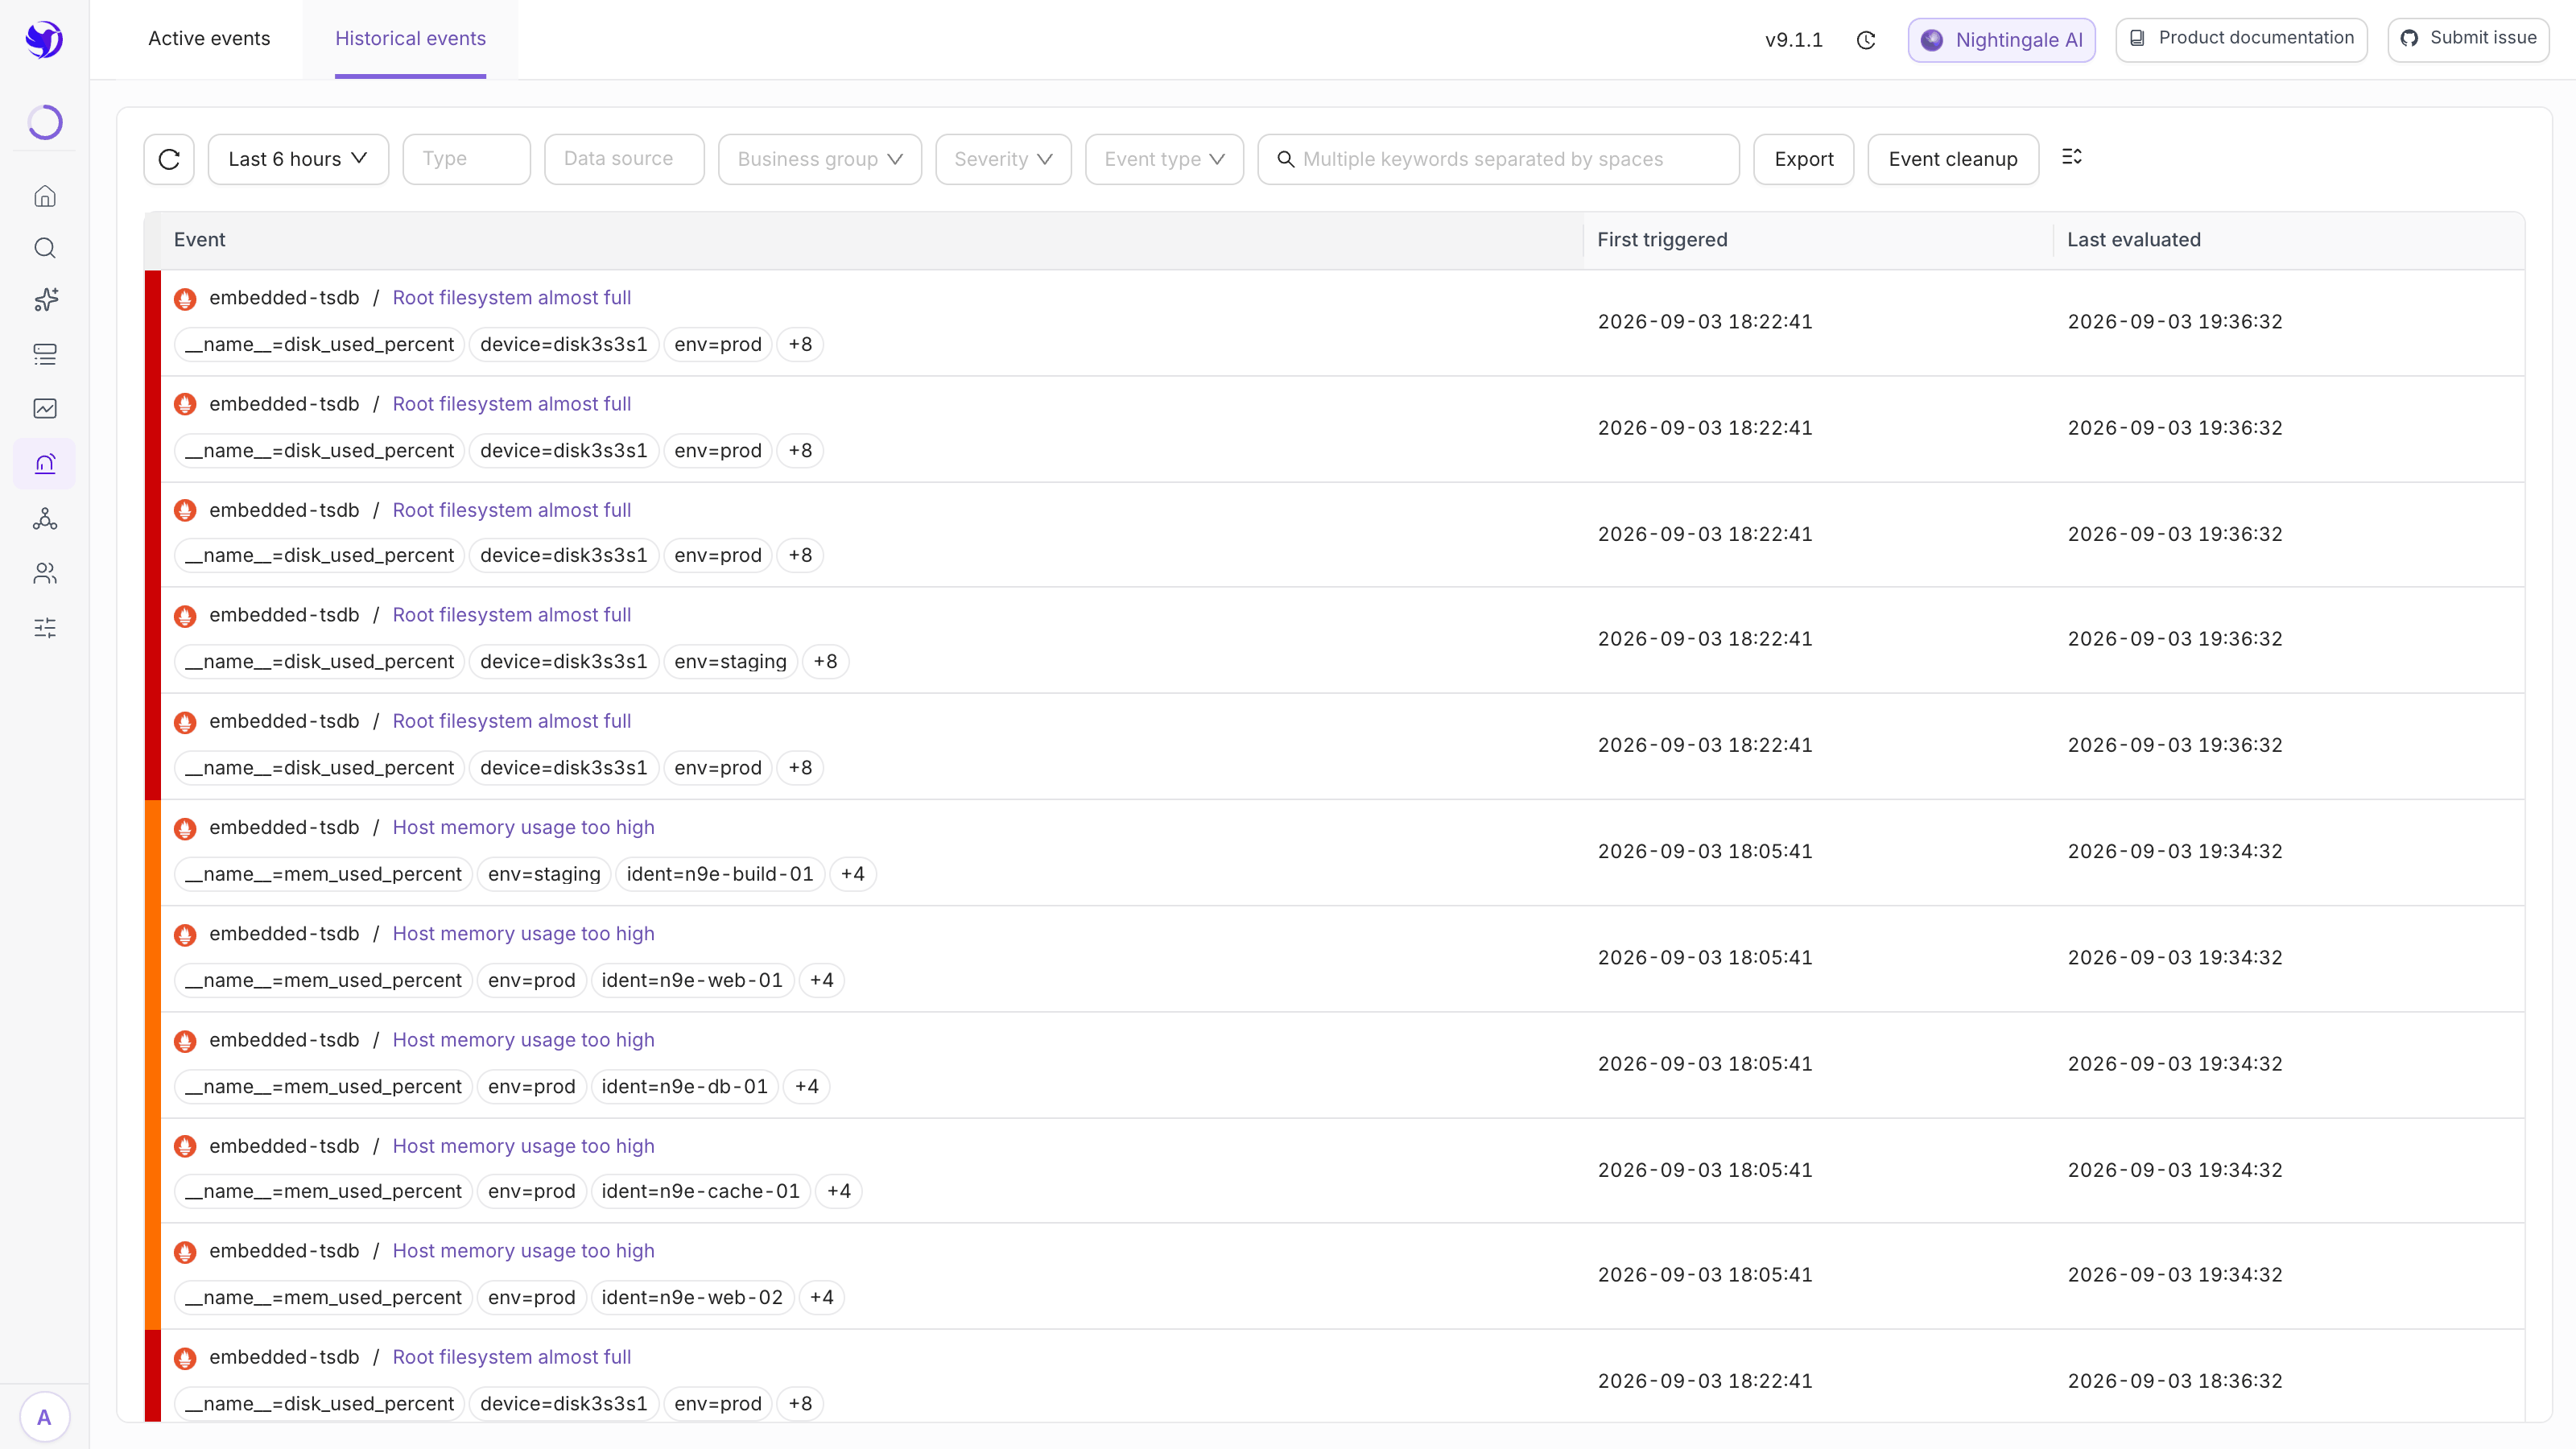
The historical columns differ from the active ones: First triggered (when it entered the alerting state) and Last evaluated (when evaluation last confirmed it was still firing, or recovered) are separate columns. Those two are what you reconstruct a timeline from.
Two buttons at the top right:
- Export: dumps the events matching the current filters, for a monthly review;
- Event cleanup: bulk delete by severity plus "older than 1 month / 3 months / 6 months / 1 year". Deleted rows are gone for good, so confirm the match with the filters first.
Historical events never expire on their own; leaving them unattended grows the table. Put a periodic cleanup on your operations checklist.
Next
- Silence a class of event during a window: Mute rules
- Let another team receive them too: Alert subscriptions
- What else happens between event and person: Noise reduction and routing model
- An event that never recovers: Alerts fire and recover repeatedly