Built-in metric views
Pre-built views for hosts, containers and common middleware, and how to add your own.
Where this page ends: charts from clicking metric names instead of writing PromQL, and your team's own queries added to the same catalogue so colleagues who do not write PromQL can use them too.
What this page is for
You have just connected a component, data is arriving, and you have no idea which metrics are worth looking at. Built-in metrics is that catalogue: organised by component type and category, each entry carrying a metric name, a unit, the PromQL and a plain-language description, and charting on one click.
A fresh install ships with more than 1300 entries covering Linux, MySQL, Redis, Nginx, Kafka, ClickHouse, Kubernetes and other common components.
Compared with the Metrics explorer: that one is for people writing PromQL during an incident; this one is for routine checks and for finding out what a newly connected component even exposes.
Explorer → Metrics → Built-in metrics (/metrics-built-in).
1. Set a filter before clicking a metric
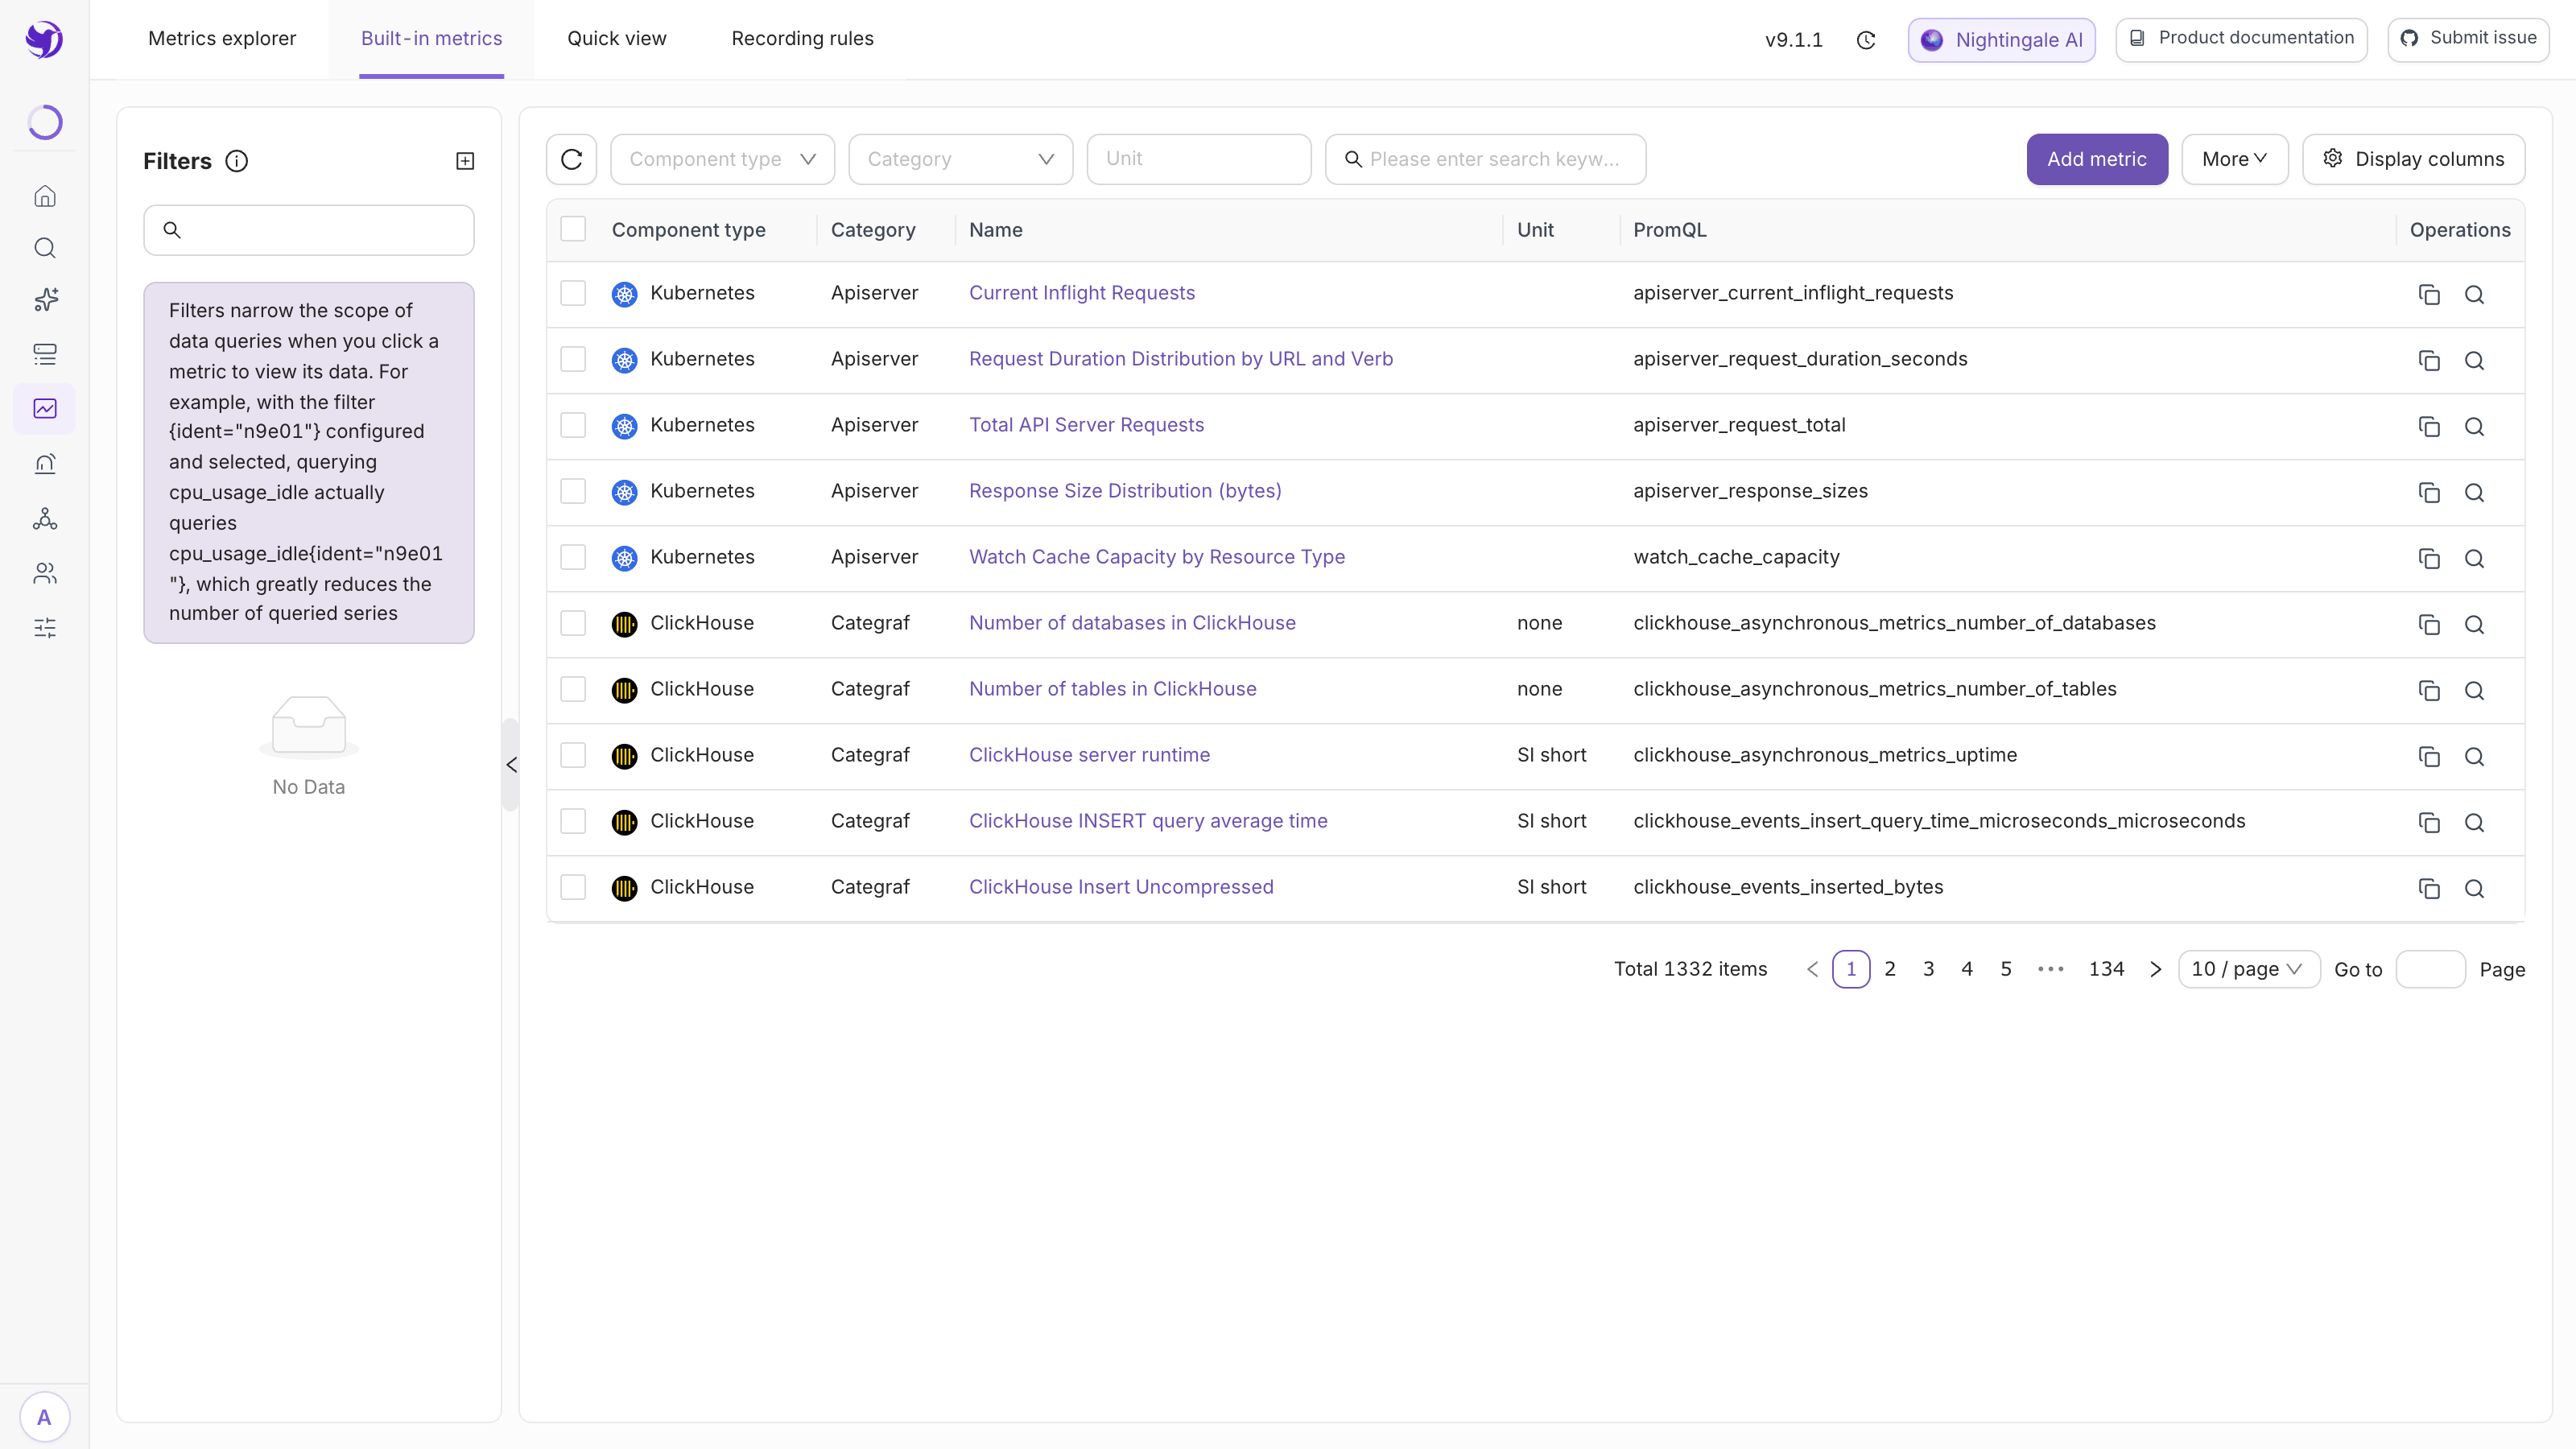
The left column is Filters, and its job is to attach a set of label conditions to the query whenever you click a metric.
In the product's own words: with {ident="n9e01"} configured and selected, clicking
cpu_usage_idle actually issues cpu_usage_idle{ident="n9e01"}.
Set one up before you start clicking. Without it, a metric like cpu_usage_idle returns
every series in the environment — thousands of lines, and a stalled browser.
Click + at the top of the left column:
| Field | What to put in it |
|---|---|
| Name | Something recognisable, e.g. "Trading production" |
| Data source | Which source this filter applies to |
| Filter conditions | The label conditions, e.g. ident="n9e01" |
| Authorized teams | Which teams may use it, and whether read and write or read only |
2. Find the metric you want
Four filters across the top: Component type (Linux, MySQL, Kubernetes…), Category (the second level, e.g. cpu / mem / disk under Linux), Unit, and a keyword search that matches the name, the PromQL and the description.
The table shows five columns by default: component type, category, name, unit, PromQL. Display columns at the top right adds expression type, metric type, custom fields, description and updated-by.
The Name column actually renders the metric's description, and it is a link; the real expression is in the PromQL column. Clicking it opens a query drawer that charts it straight away, and Add panel in that drawer stacks several metrics for comparison.
With rows selected, More offers export (JSON), import and delete.
3. Add one of your own
Click Add metric:
| Field | What to put in it |
|---|---|
| Component type | Pick an existing one or create a new one |
| Category | The second level |
| Expression type | Metric name (just a name) or PromQL (a full expression with functions) |
| Metric type | Gauge / Counter / Histogram |
| PromQL | The query itself |
| Unit | Used for display conversion |
| Custom fields | Name plus value, for whatever context you want to carry |
| Metric description | Per language: Name (required) and Description — this is what the list shows |
Note: there is no top-level name field. The name lives inside the per-language description block, so a metric filled in only in Chinese will not show a name in the English UI.
Creating, editing and deleting are gated by the /builtin-metrics/add, /put and /del
permission points.
Where the catalogue comes from
This decides where you go to change something:
- The 1300-odd built-in entries come from
integrations/<Component>/metrics/*.jsonin the backend and are loaded when n9e-center starts. No UI action triggers it, and there is nothing for you to "import"; - Metrics you create here are stored in the database. For the same PromQL, the database row wins over the file — so when a built-in entry cannot be edited, the workaround is to create a new one with the same PromQL;
- Integrations → Components has a Metrics tab under each component. That is another view onto the same data; editing either side is equivalent.
Two other places consume this catalogue: the Built-in metrics button beside the PromQL input in the Metrics explorer, and the one-click drawer on the host list.
Next
- Write the PromQL yourself: Metrics explorer
- Look at things host by host: Object quick view
- What else a component template carries: Import dashboards and rules