Build a dashboard
A dashboard belongs to a business group; build it from an integration template or from scratch with twelve panel types, and export it whole to hand to someone else.
Where this page ends: a dashboard owned by a business group, with at least one panel drawing real data, saved and exportable to hand to someone else.
First decide: import a template or start empty
- Monitoring a common component (Linux, MySQL, Redis, Nginx…): a usable board almost certainly already ships with the template, and importing then adjusting beats drawing from scratch;
- Monitoring your own business metrics: start empty.
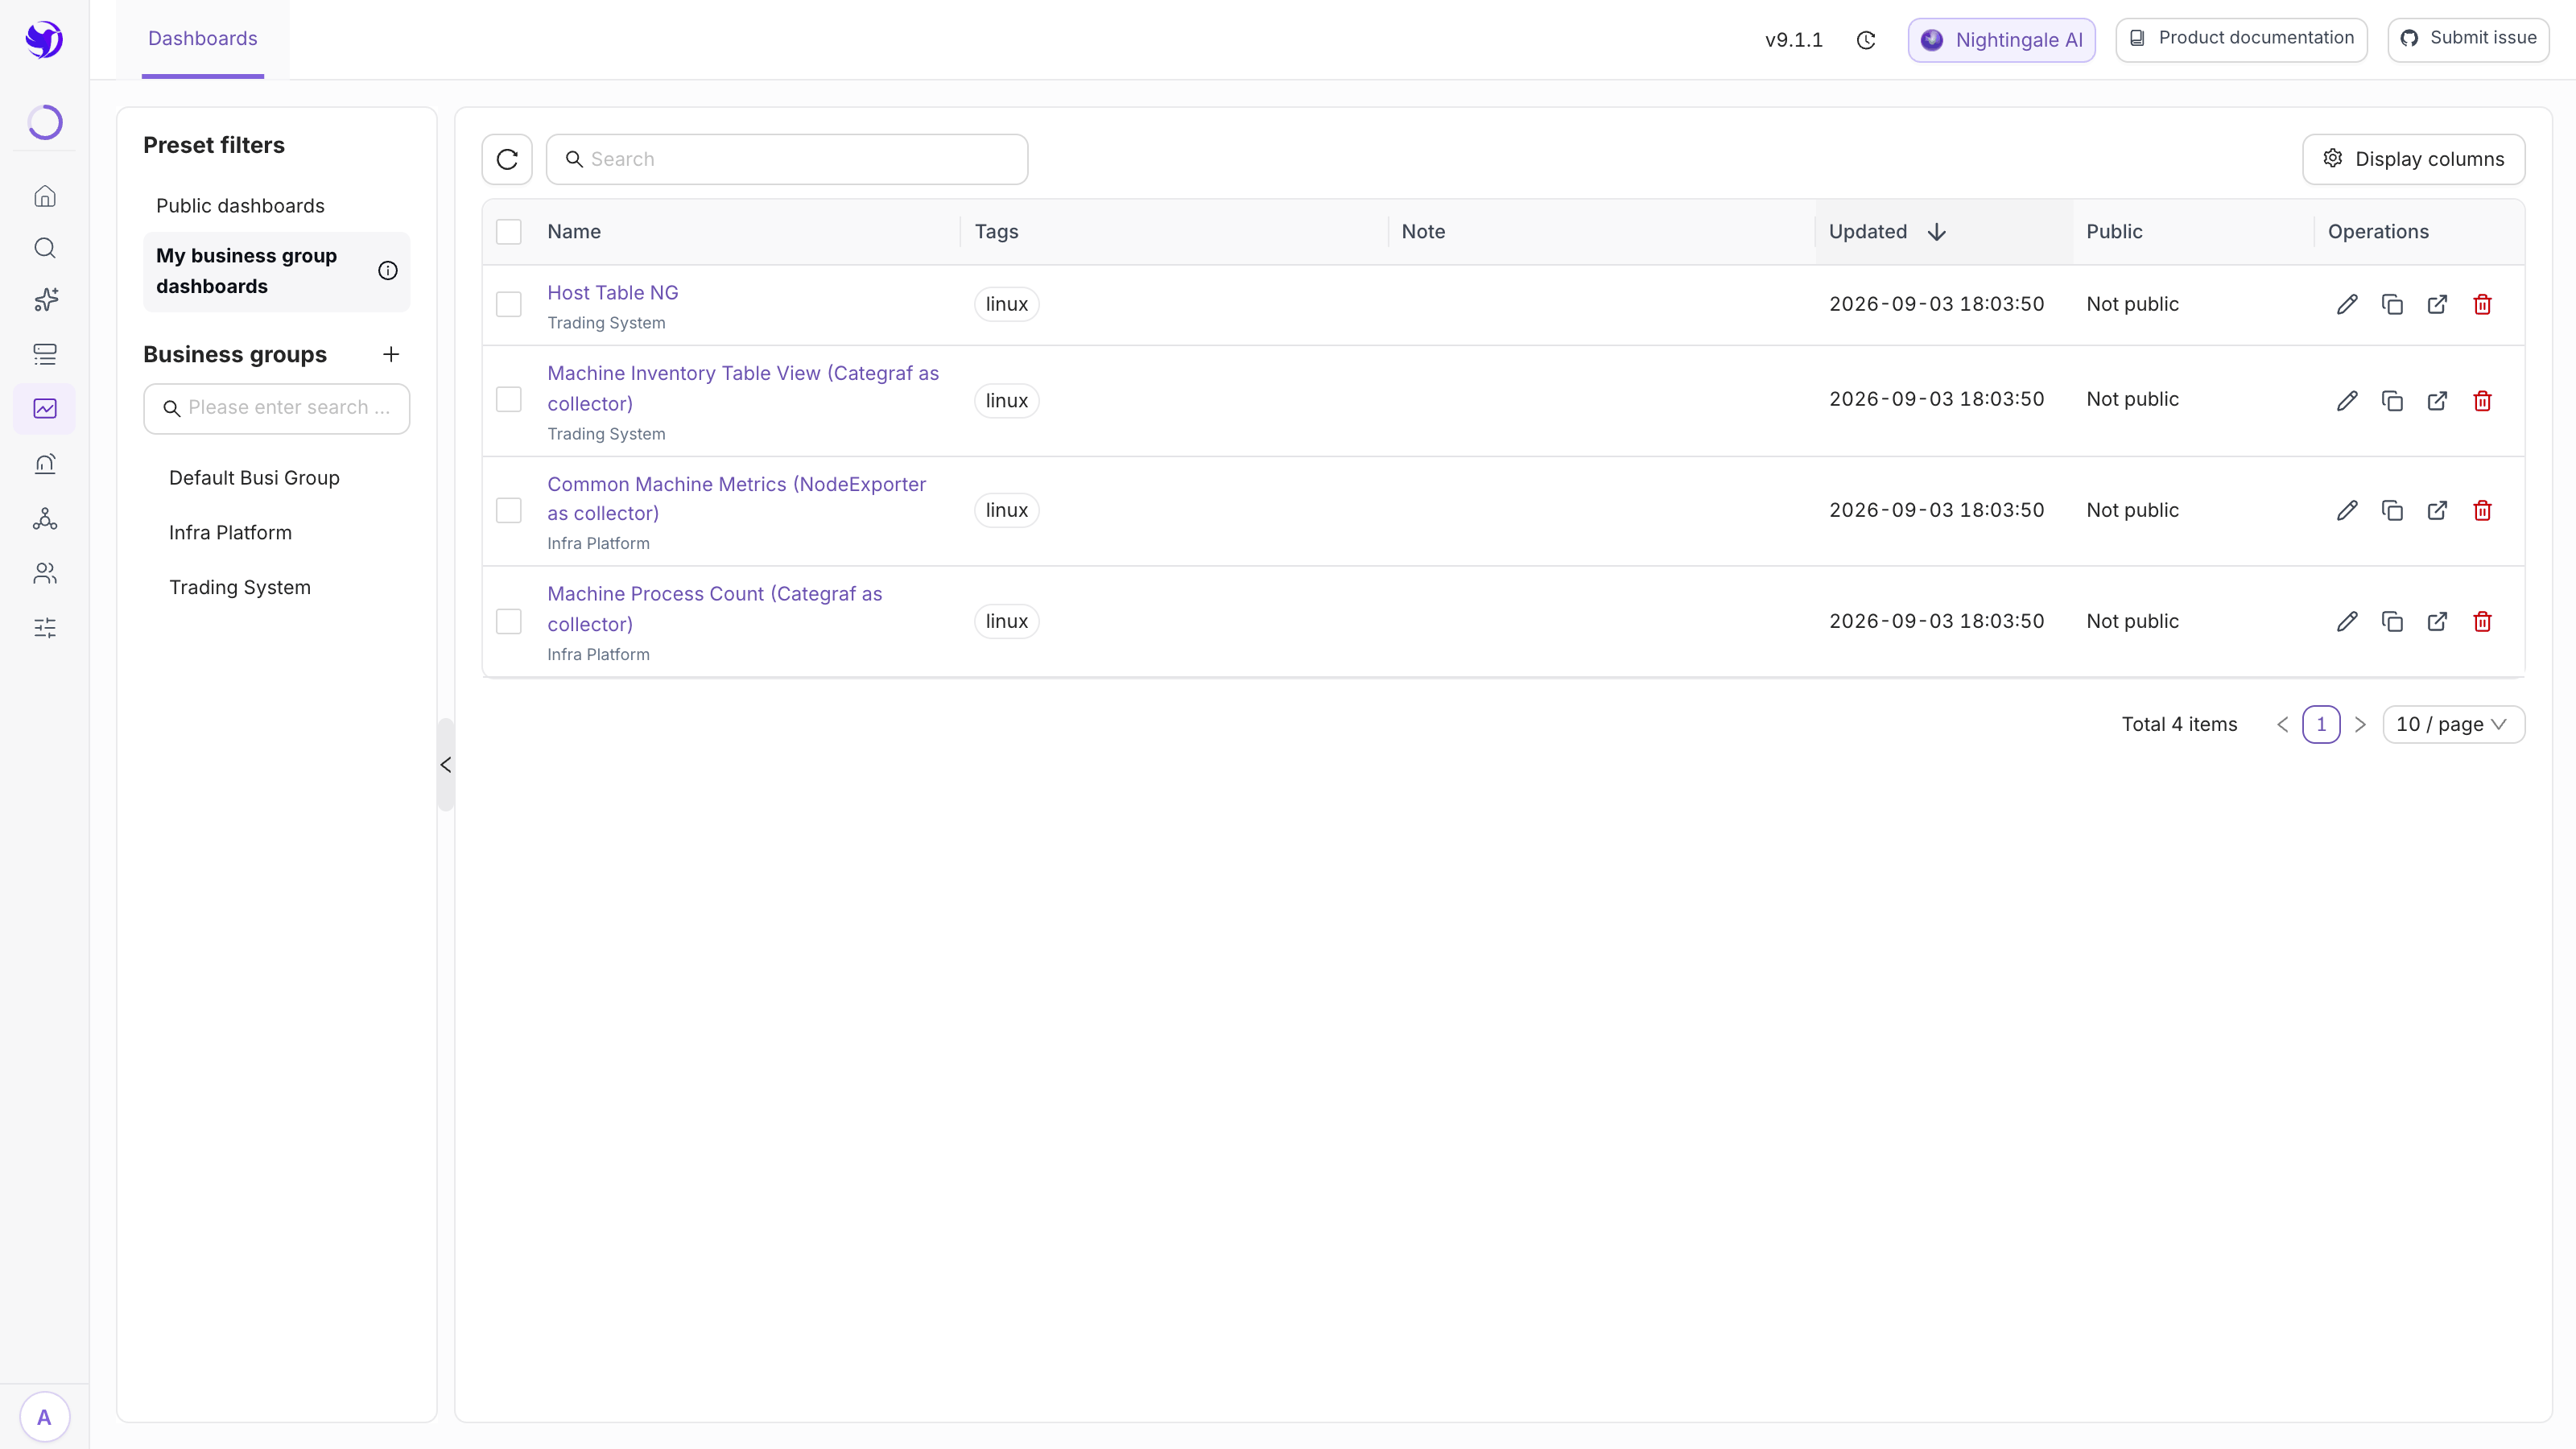
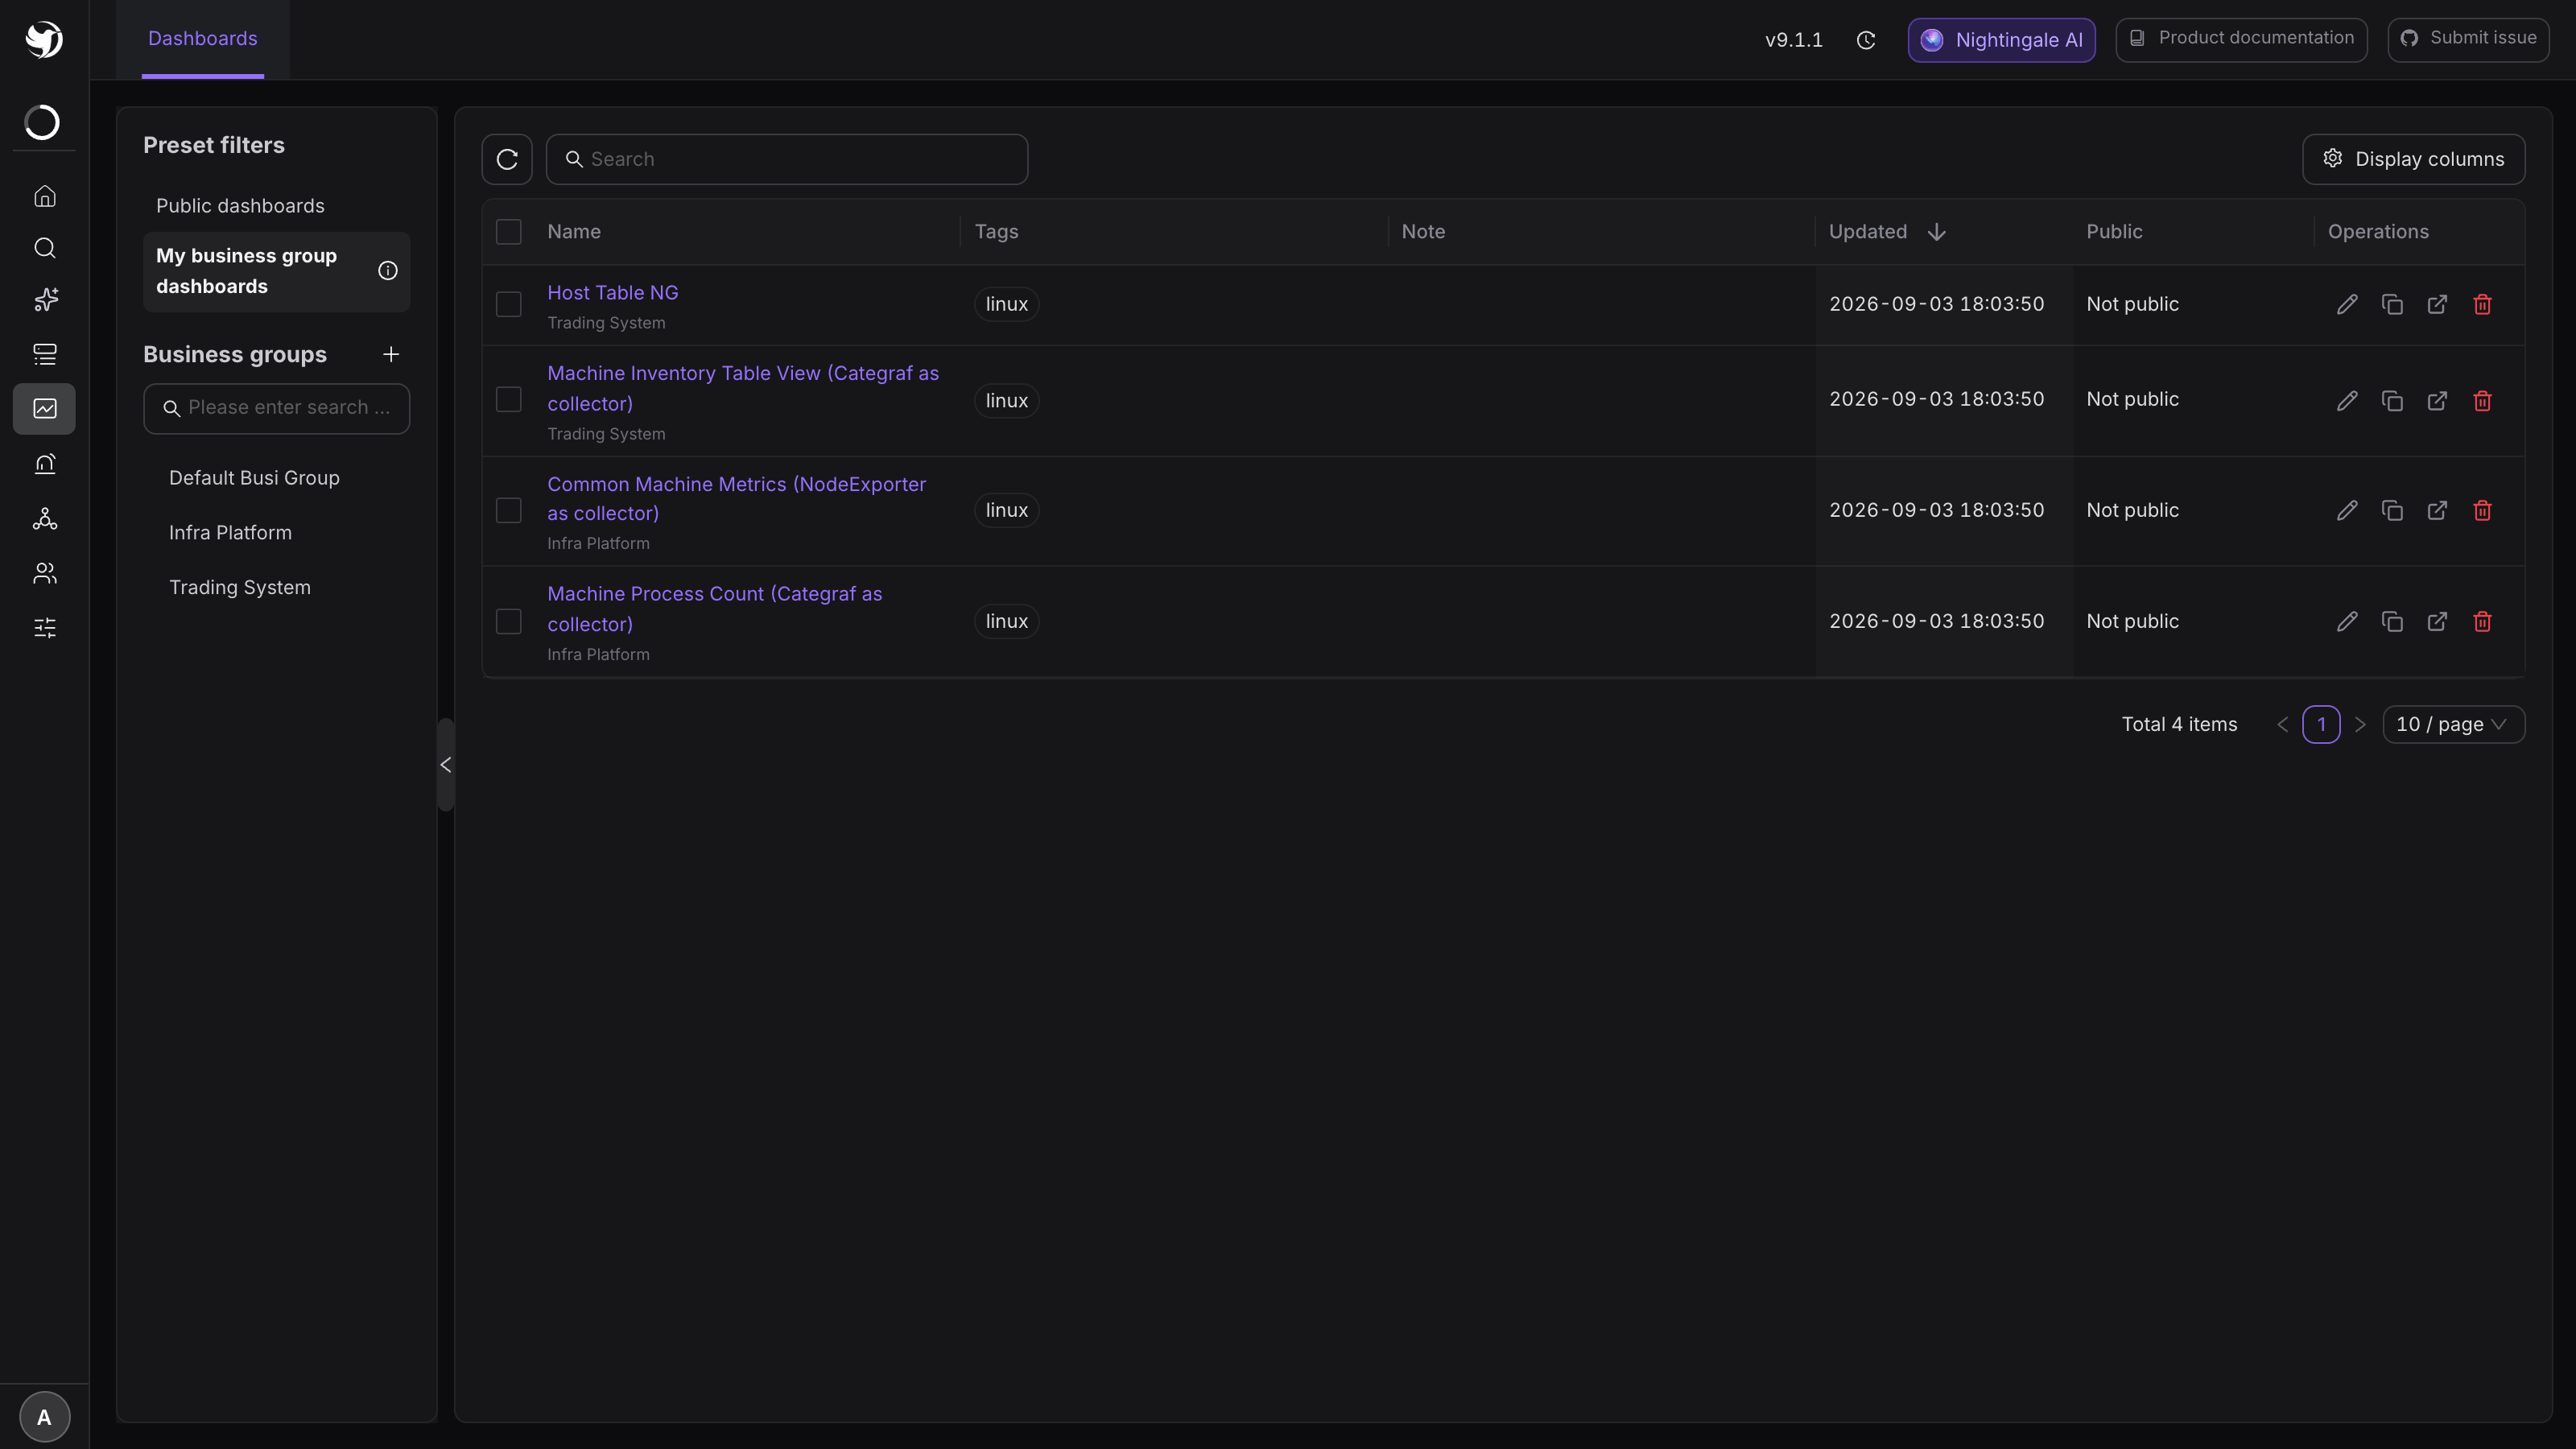
Either way, note one thing first: the Add / Import / More buttons only appear once a specific business group is selected on the left. While the sidebar sits on the preset filters "My business group dashboards" or "Public dashboards", the buttons are hidden — that is not a permission problem, click a real group and they come back.
1. Import from an integration template
Explorer → Dashboards (/dashboards), pick a business group on the left, then Import.
The dialog has four tabs:
| Tab | When to use it |
|---|---|
| Import built-in dashboard (default) | Pick a component (MySQL, Redis…), then tick the dashboards shipped with it. This is the usual path |
| Import Grafana dashboard URL (recommended) | Converts nothing; creates an iframe-mode dashboard that embeds your Grafana page |
| Import Nightingale dashboard JSON | Paste JSON exported from another Nightingale |
| Import Grafana dashboard (not recommended) | Beta, converts Grafana dashboard JSON into Nightingale's model. Plenty of limits — see Use Grafana with Nightingale |
Expected result: the boards appear in the list and open with charts on them. If the charts are empty, do not start editing the board — the component's metrics probably are not arriving yet; go back to Verify incoming data.
The templates themselves live under Integrations → Components, which offers the same set of dashboards. Importing collector config and alert rules alongside them is covered in Import dashboards and rules.
2. Start empty and add the first panel
Click Add, give the dashboard a name (ident, tags and note are optional). Saving takes you straight to the detail page.
Click Add panel. Besides the 12 visualization types, the dropdown offers Row (a collapsible horizontal divider) and Paste panel (panel config JSON copied elsewhere).
Pick a type to open the panel editor. It is a full-screen modal with two columns, not tabs:
- Left: the variable bar on top, a live preview in the middle, the query editor below. That query editor is the same one the Metrics explorer uses, so the preview updates as you type. Text and Iframe panels have no query editor.
- Right: a stack of collapsible sections, of which a type-specific subset appears — Panel options (name, description, links, repeat by variable), Graph styles, Legend, Tooltip, Value mappings, Standard options, Thresholds, Colors, Links, Override.
The modal header also carries the visualization-type selector and a time range picker. Change the chart type there rather than deleting the panel and adding a new one.
Click Save to return to the dashboard, then drag a panel's edge to resize it and its title to move it.
3. The twelve panel types
| Type | What it is for |
|---|---|
| Time series | The default. One or more lines over time |
| Bar chart | Comparing categories, or counts bucketed by time |
| Stat | One big number, coloured by threshold |
| Table NG (Beta) | The newer table with more features; use it for new panels |
| Table | The older table, still used by existing panels |
| Pie chart | Proportions |
| Hexmap | Many instances on one screen, spot the outlier by colour |
| Bar gauge | Top N as horizontal bars |
| Text | Prose and links; queries nothing |
| Gauge | A single value against a range |
| Heatmap | How a distribution changes over time |
| Iframe | Embeds an external page |
Switching Table to Table NG raises a confirmation offering Auto upgrade (carry the old options over where possible) or Switch type only (start the options fresh).
4. Rows, time range and links
- Rows:
Add panel → Rowinserts a collapsible divider. Deleting one asks whether to delete the row and its panels or delete the row only. - Time range and auto refresh: top right. The selected range goes into the URL
(
__from/__to/__refresh) and is remembered per dashboard in the browser. Refresh intervals are 5s / 10s / 20s / 30s / 1m / 2m / 3m / 5m / 10m. A refresh interval shorter than the query step buys nothing, and the UI says so. - Links: the link icon in the title bar configures jump targets (name, URL, open in a new tab), which is how you chain related boards together.
- Dashboard settings (the gear): name, ident, tags, note, plus two behaviour switches — Graph tooltip (Default / Shared crosshair / Shared tooltip) and Graph zoom (Default / Update time range).
- Variables: the entry point sits at the end of the variable bar, showing "Add variable" while there are none. See Variables and filters.
Save, export, move a panel elsewhere
Changes are not saved automatically. After adding panels and adjusting the layout, click Save dashboard in the title bar; leaving with unsaved changes prompts first.
- A whole board: Export on the list row gives you JSON, with Download JSON and Copy JSON to clipboard. Paste it back elsewhere through "Import Nightingale dashboard JSON". The JSON in that box can be selected and copied, but editing it writes nothing back — there is no edit-JSON feature.
- Into another business group: use Clone. The copy is independent; the two are maintained separately from then on.
- A single panel: the panel's own menu has Copy, which puts that panel's config JSON
on the clipboard; on the target dashboard use
Add panel → Paste panel. The same menu also holds Refresh / Edit / Clone / Share / Inspect / Delete, and table panels add Export (CSV).
Next
- Make one board serve many hosts: Variables and filters
- Show it to someone without an account: Anonymous time-limited sharing
- Import the template's rules too: Import dashboards and rules