Built-in metrics and health checks
The /metrics and health endpoints each process exposes, and the handful worth graphing.
n9e, n9e-edge, n9e-alert and n9e-pushgw share one HTTP skeleton, so the endpoints below are
the same on every process — only the port differs (17000 for Center, 19000 for edge).
Endpoints every process has
| Endpoint | Returns | Use it for |
|---|---|---|
GET /ping | pong | Load balancer and Kubernetes probes; the cheapest check |
GET /pid | The process PID | Confirming which process you reached |
GET /ppid | The parent PID | Telling whether a supervisor started it |
GET /addr | The caller's address | Answering "which IP am I actually coming from" |
GET /api/n9e/version | The version, e.g. v9.1.1 | Checking instances one by one during a rolling upgrade |
GET /metrics | Prometheus-format self metrics | See the next section |
GET /api/debug/pprof/* | Go pprof | CPU and memory work — see Logs and diagnostic bundles |
GET /dumper/sync | Config sync status per cache | Local requests only; answers "I changed config and nothing happened" |
Try it:
curl --noproxy '*' http://n9e:17000/ping            # pong
curl --noproxy '*' http://n9e:17000/api/n9e/version # v9.1.1
/ping only proves the HTTP server is still listening. It says nothing about whether the database
is reachable or rules are being evaluated — that judgement comes from /metrics.
Two switches: [HTTP] ExposeMetrics defaults to true, and [HTTP] PProf defaults to true in
etc/config.toml but false in etc/edge/edge.toml.
The handful worth graphing
/metrics is thousands of lines, most of it Go runtime internals and per-route HTTP histograms.
These are the ones that answer "is the system still doing its job".
Is evaluation still running
| Metric | Meaning |
|---|---|
n9e_center_uptime | Seconds since process start; a reset to zero means a restart (Center only) |
n9e_alert_rule_eval_total | Total rule evaluations, no labels. If it stops climbing, evaluation stopped |
n9e_alert_rule_eval_error_total | Evaluation errors, labelled datasource / stage / busi_group / rule_id |
n9e_alert_rule_eval_duration_ms | Last evaluation duration per rule, labelled rule_id / datasource_id |
n9e_alert_query_data_error_total | Failed data source queries, labelled datasource |
n9e_alert_alerts_total | Alert events produced, labelled cluster / type / busi_group |
n9e_alert_alert_queue_size | In-memory event backlog; persistently non-zero means processing is behind |
Is data still arriving
| Metric | Meaning |
|---|---|
n9e_pushgw_samples_received_total | Samples received, labelled channel (prometheus, opentsdb, …) |
n9e_pushgw_sample_received_by_ident | Samples per host, labelled host_ident; makes a silent host obvious |
n9e_pushgw_sample_queue_size | Forwarding queue depth, labelled queueid (one queue per CPU) |
n9e_pushgw_push_queue_over_limit_error_total | Whole remote-write requests rejected because the queues were over the watermark |
n9e_pushgw_push_queue_error_total | Samples dropped because one queue was full, labelled queueid |
n9e_pushgw_drop_sample_total | Samples discarded by the [Pushgw.DebugSample]-style drop filters |
n9e_pushgw_write_total / n9e_pushgw_forward_duration_seconds | Samples written out and how long it took, labelled url |
Are the dependencies healthy
| Metric | Meaning |
|---|---|
n9e_db_pool_open_connections / n9e_db_pool_in_use_connections | Pool usage; approaching [DB] MaxOpenConns means queuing |
n9e_db_pool_wait_count_total / n9e_db_pool_wait_duration_seconds_total | Waits for a connection; non-zero means tune the pool or find the slow queries |
n9e_db_operation_total | Database operations, labelled operation / status / table |
n9e_center_redis_operation_latency_seconds | Redis latency histogram |
n9e_center_http_request_duration_seconds | HTTP latency histogram, labelled code / method / path |
The embedded TSDB (only on a Center with [EmbeddedTSDB] on)
It uses the Prometheus storage engine, so its metrics are the standard ones:
prometheus_tsdb_head_series (active series right now),
prometheus_tsdb_head_samples_appended_total, prometheus_tsdb_storage_blocks_bytes,
prometheus_tsdb_wal_corruptions_total, and prometheus_engine_queries (queries executing or
queued).
The alerting engine heartbeat
There is a more direct view than metrics: System → Alerting engines. Every instance writes a heartbeat once a second, and the page lists the live instances grouped by engine cluster.
A Last heartbeat frozen at some point means that instance is in trouble; a row that disappears entirely means it went over 30 seconds without a heartbeat and was removed from the hash ring.
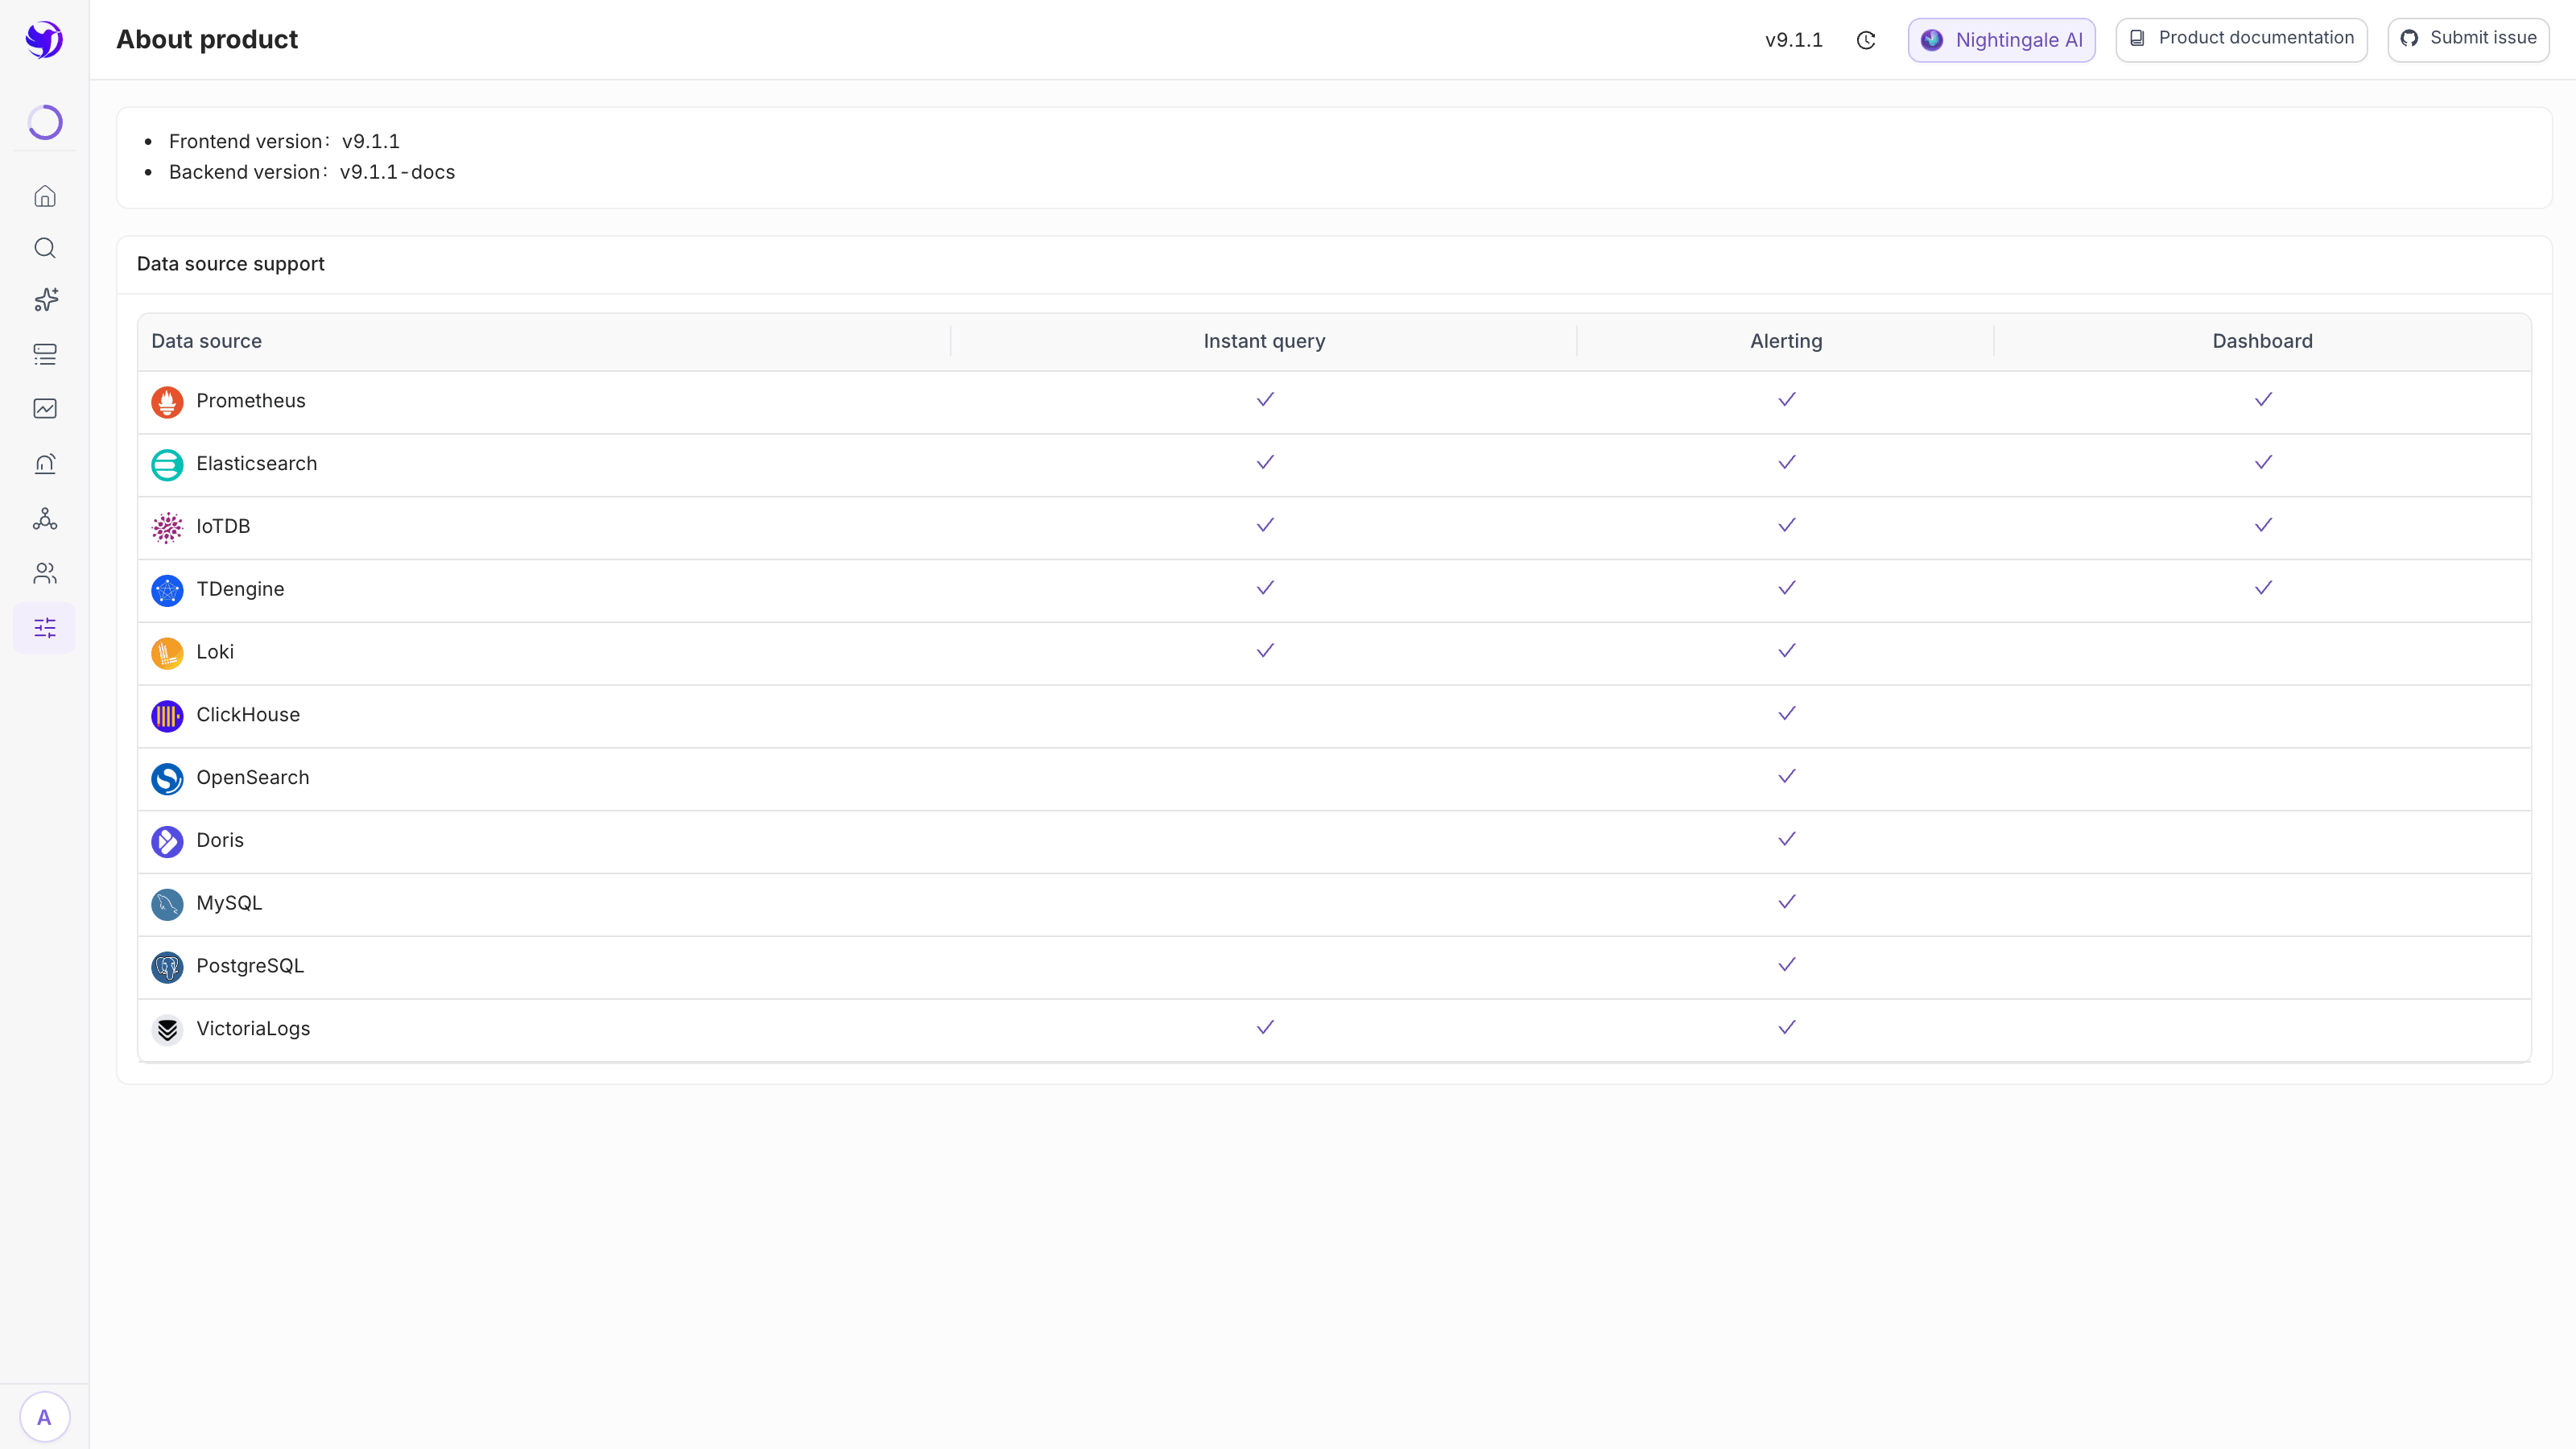
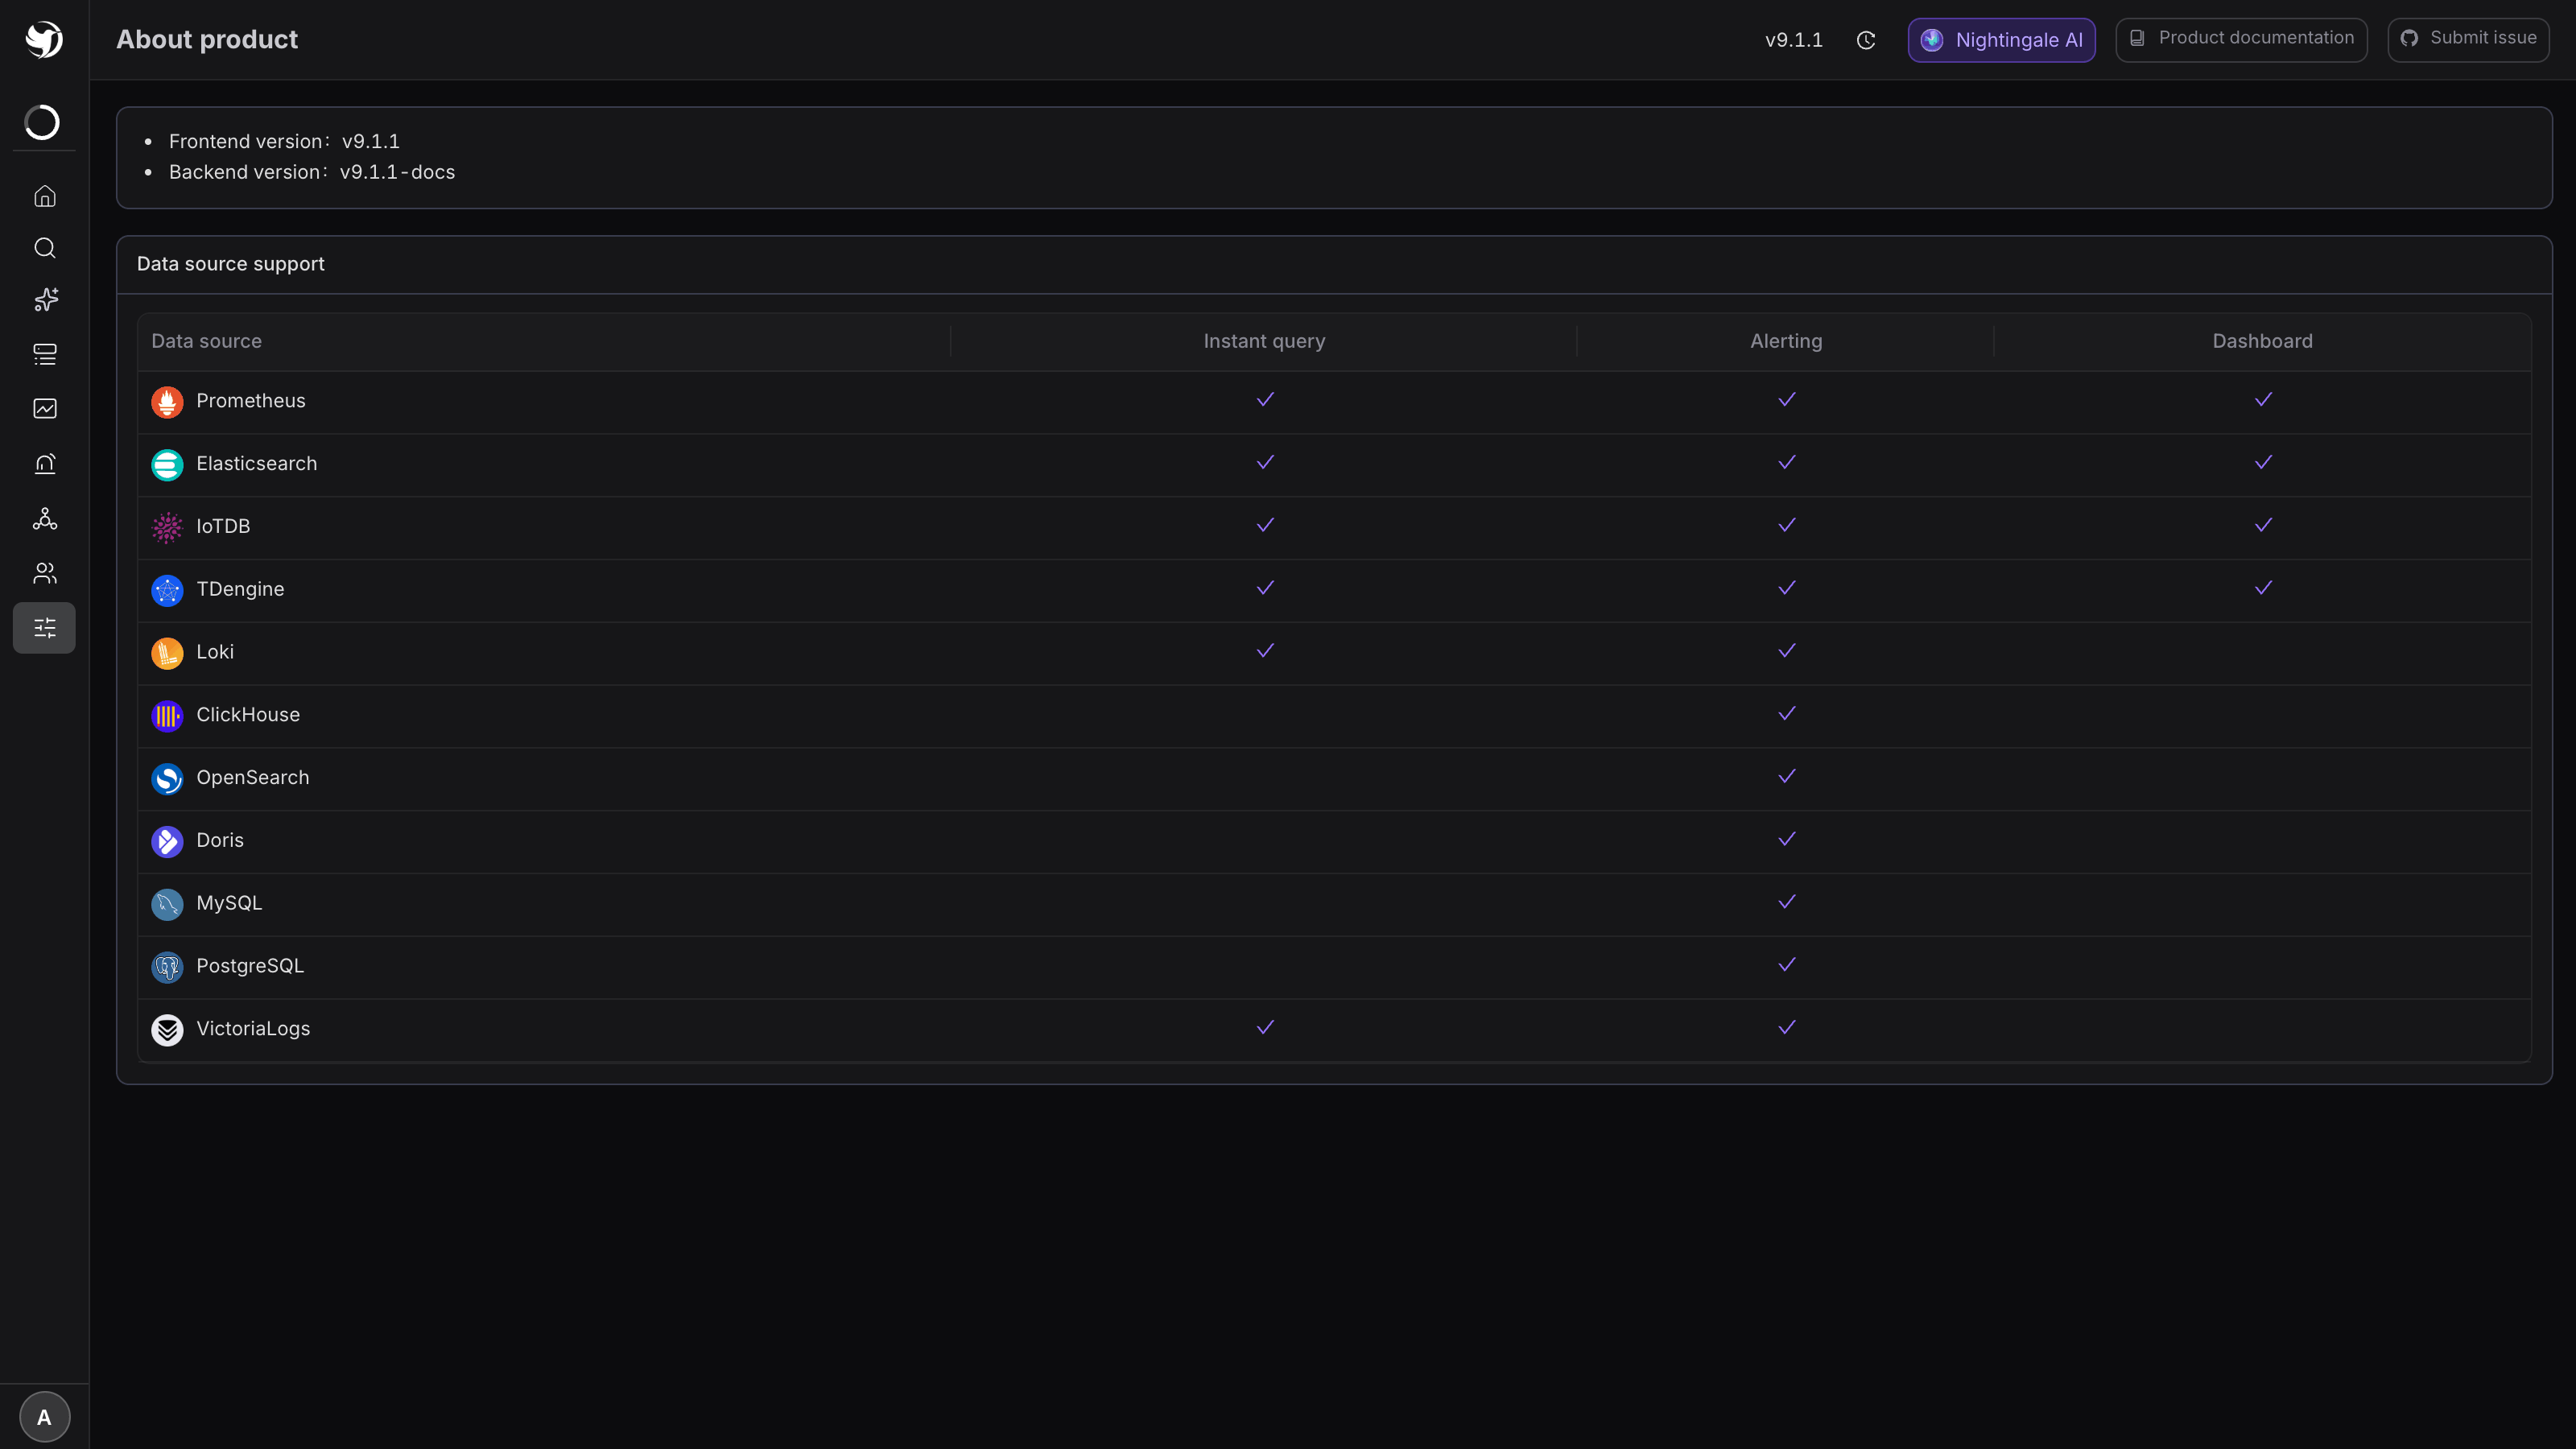
Version information lives under System → About: frontend version, backend version, and which features each data source type supports.
Labelled counters do not exist until they fire
A Prometheus CounterVec only appears on /metrics once some label combination has been recorded.
On a freshly started instance, n9e_alert_rule_eval_error_total and
n9e_alert_query_data_error_total are therefore absent, not zero.
Two ways that bites:
- using
absent(n9e_alert_rule_eval_error_total)to mean "are there errors" — it fires permanently while everything is fine; - thresholding an error counter without
rate()— it steps from nothing to something the first time it appears.
The reliable approach is to judge on a metric that is always present, such as the growth rate of
n9e_alert_rule_eval_total. Concrete rules are in
Monitor Nightingale itself.
Closing these endpoints down
Neither /metrics nor /api/debug/pprof/* requires authentication, and they share a port with the
web UI and the ingest endpoints. In production:
- set
[HTTP] PProf = falseand turn it on temporarily when you need a profile; - let only your internal collector reach
/metrics, allowlisted by path at the gateway; /dumper/syncalready refuses non-local requests, so it needs nothing extra.