How long should a Prometheus alert wait? Data from 692 rules
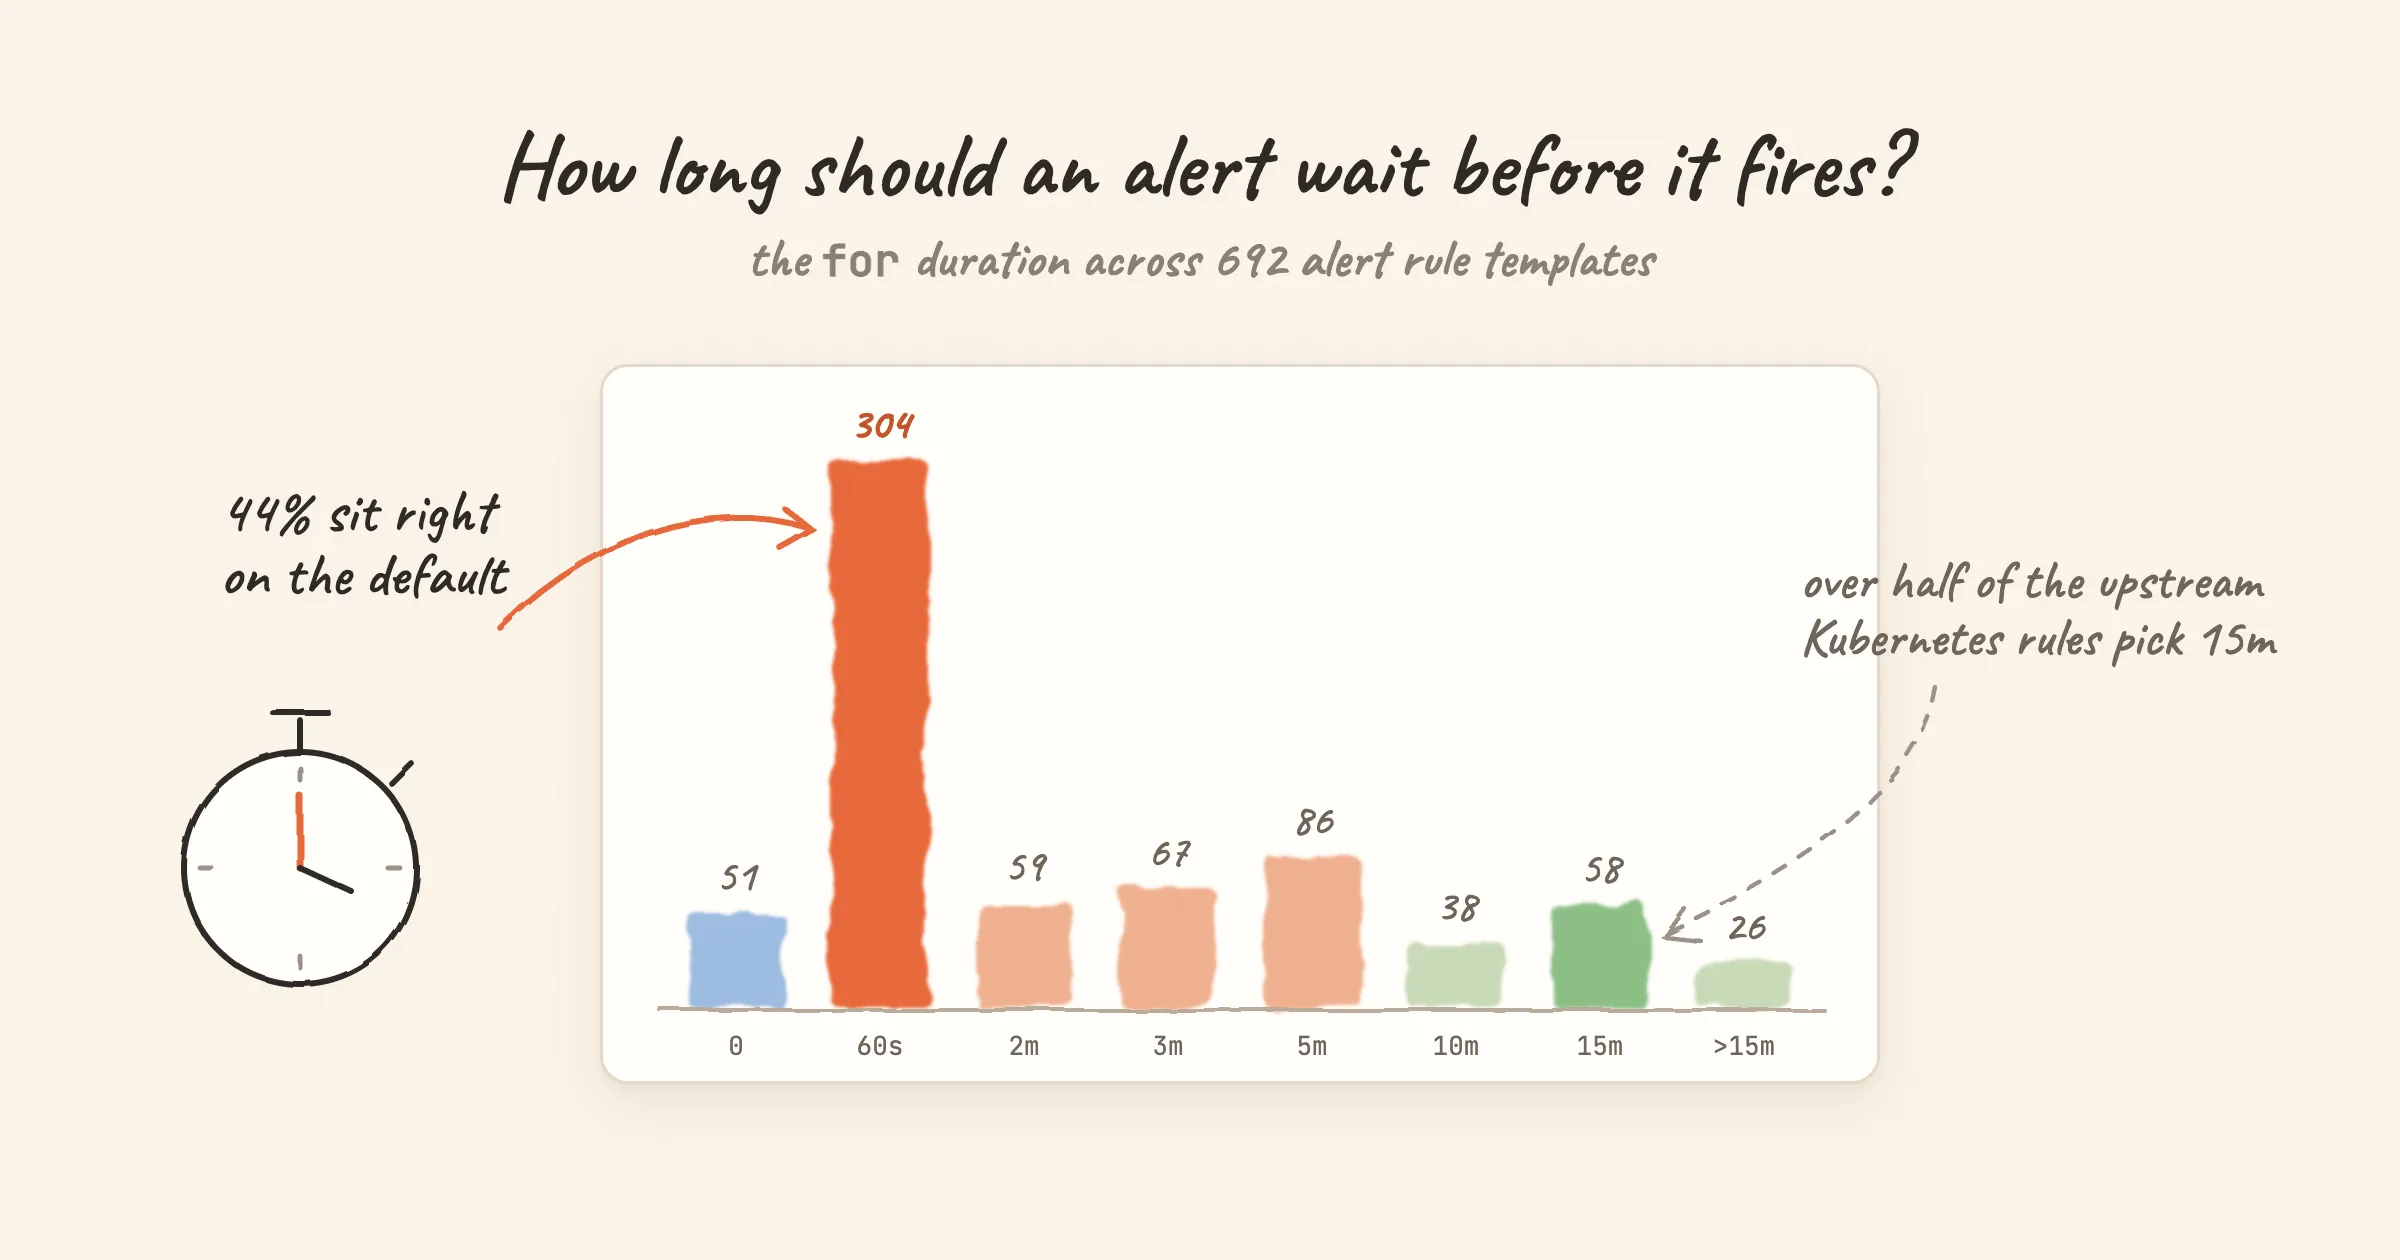
We counted the for duration and severity of 692 alert rule templates. 44% use the 60s default. Here is when for: 0, 60s, 15m and 1h are the right choice.
BLOG
Notes on alerting, Prometheus and Kubernetes monitoring from the Nightingale maintainers: data from our rule library, migration guides and design write-ups.
We counted the for duration and severity of 692 alert rule templates. 44% use the 60s default. Here is when for: 0, 60s, 15m and 1h are the right choice.
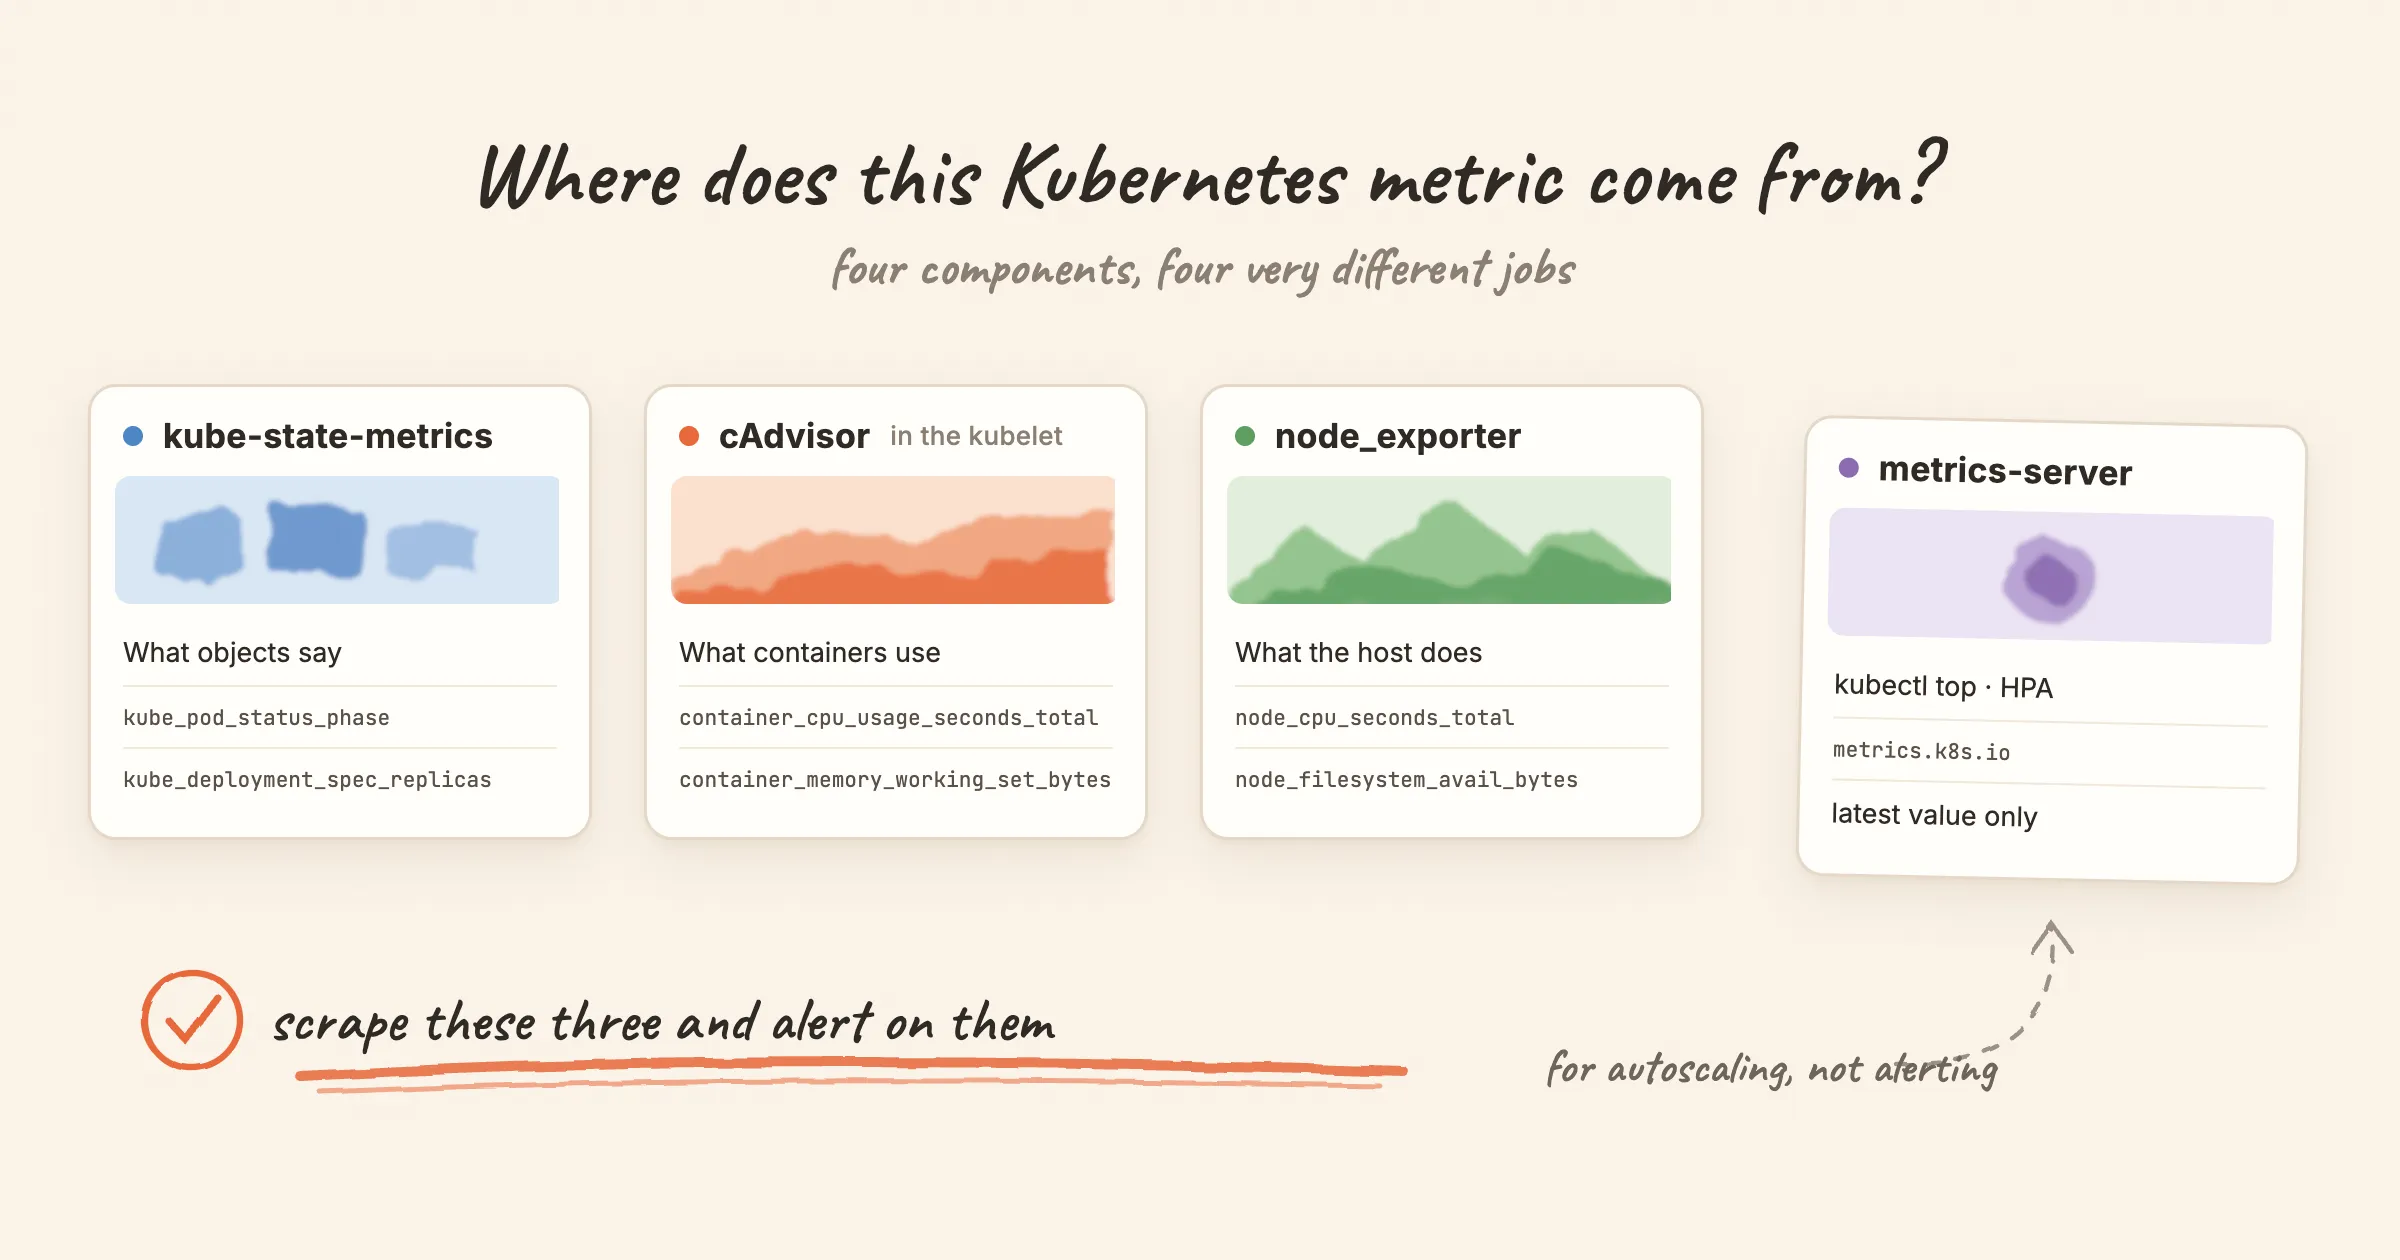
What kube-state-metrics, metrics-server, cAdvisor and node_exporter each measure, which one to alert on, and the metric renames that silently break copied queries.
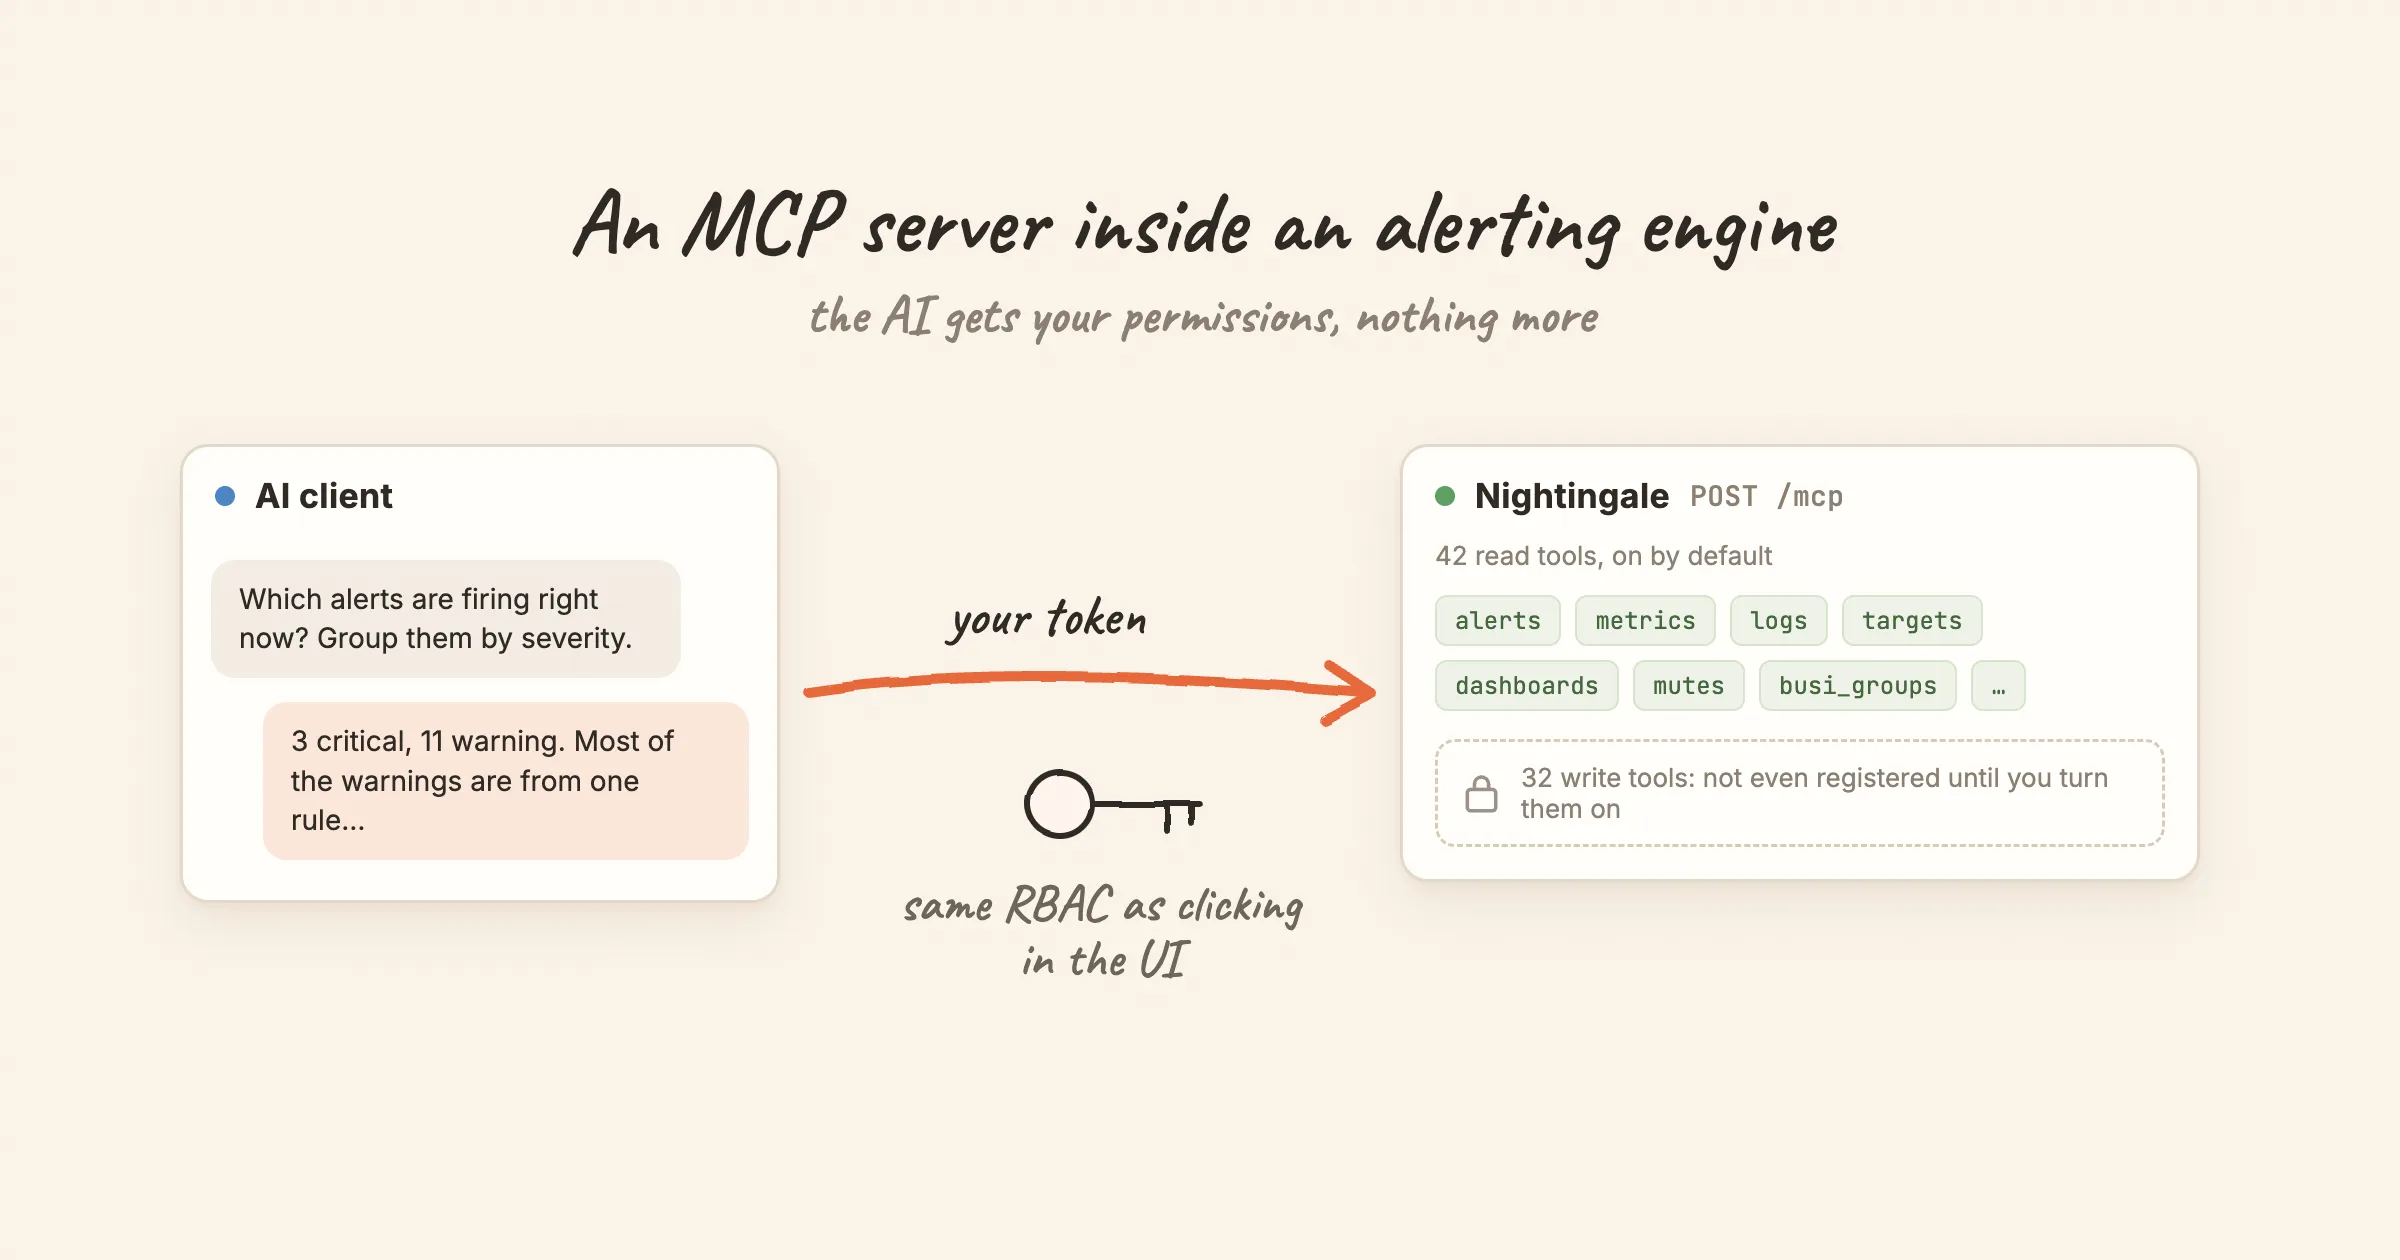
How Nightingale's built-in MCP server handles permissions, write access and audit: RBAC inherited from the token, write tools unregistered by default, no delete tools, and one caveat.
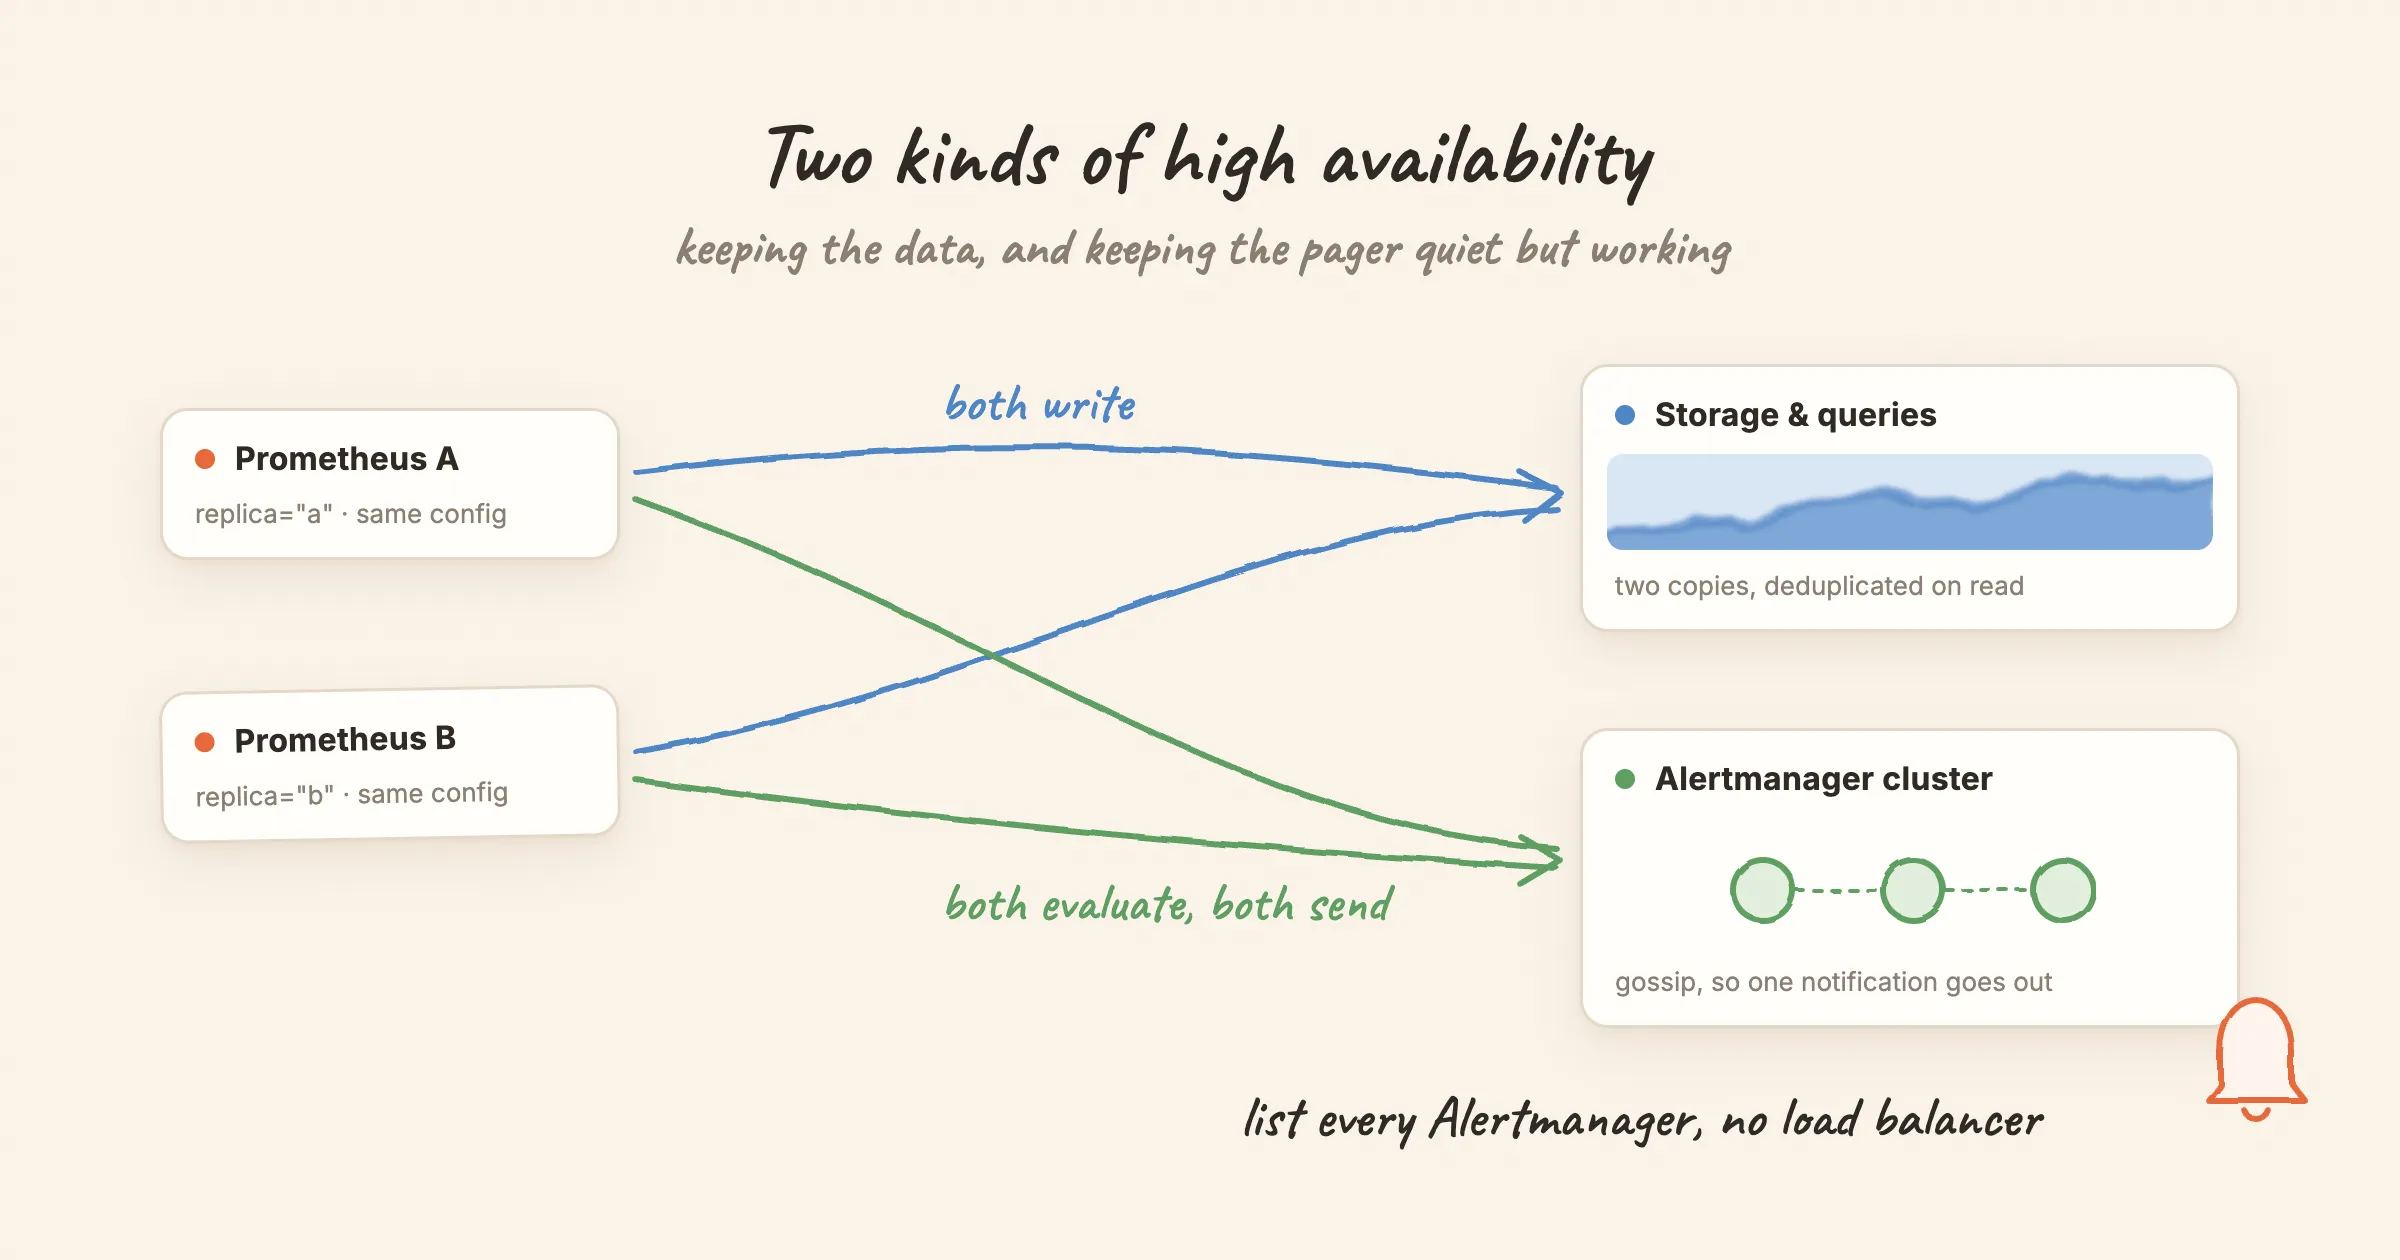
Running two Prometheus replicas solves half of high availability. How Alertmanager clustering, replica labels and Thanos, Mimir or VictoriaMetrics deduplication fit together.
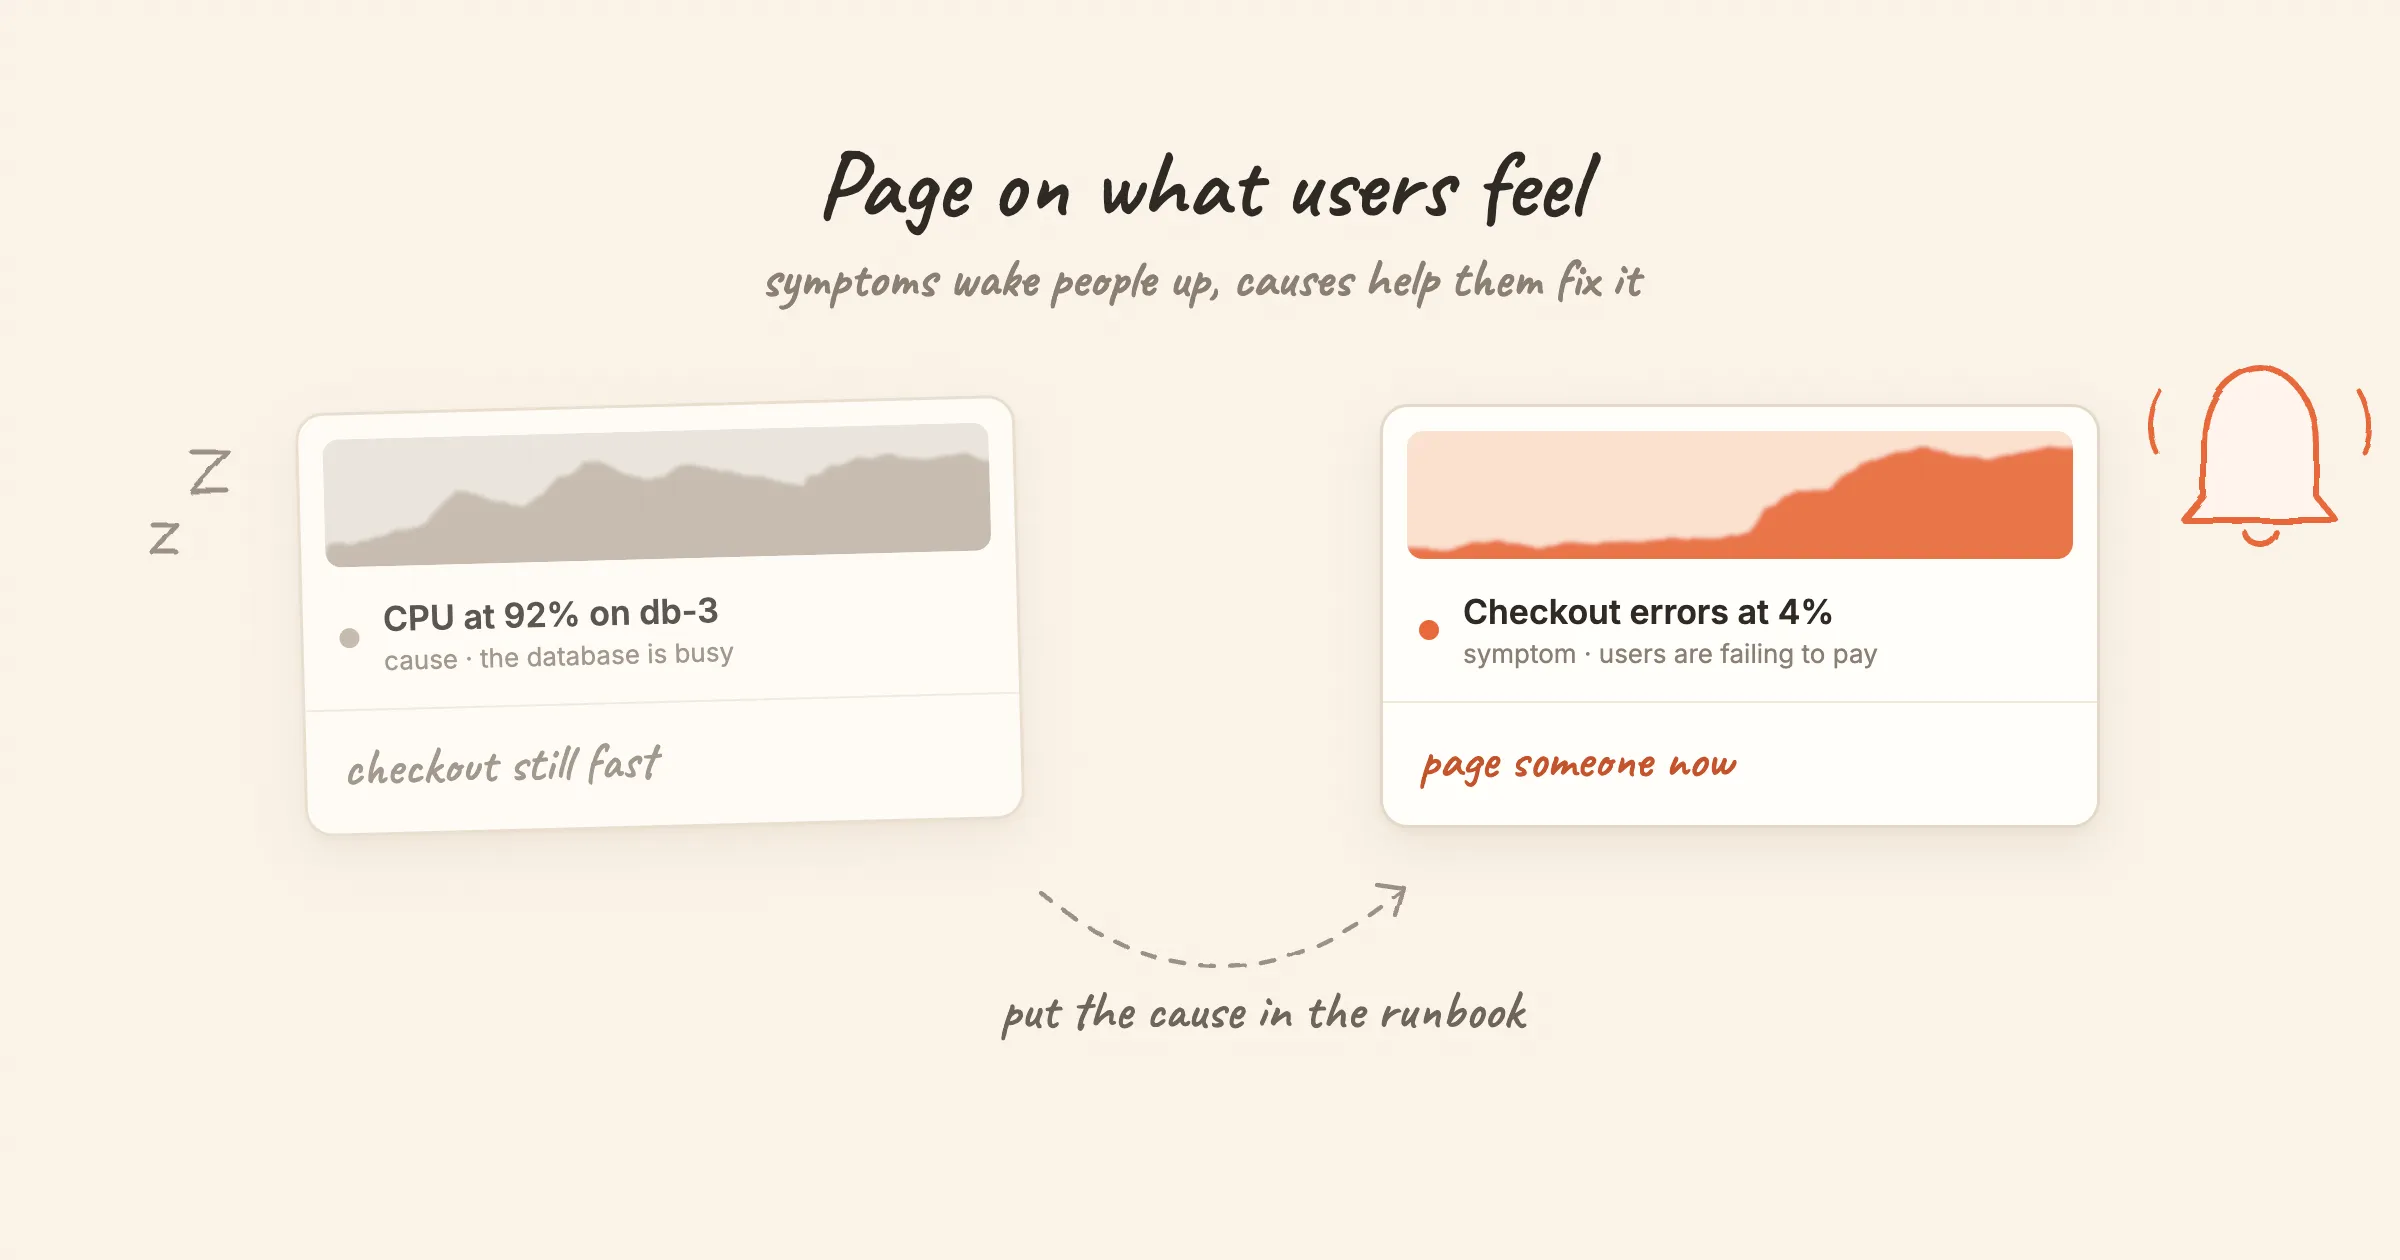
Symptom-based vs cause-based alerting with real Prometheus rules: error ratio, latency and probe alerts that page, and where CPU, disk and certificate alerts still belong.
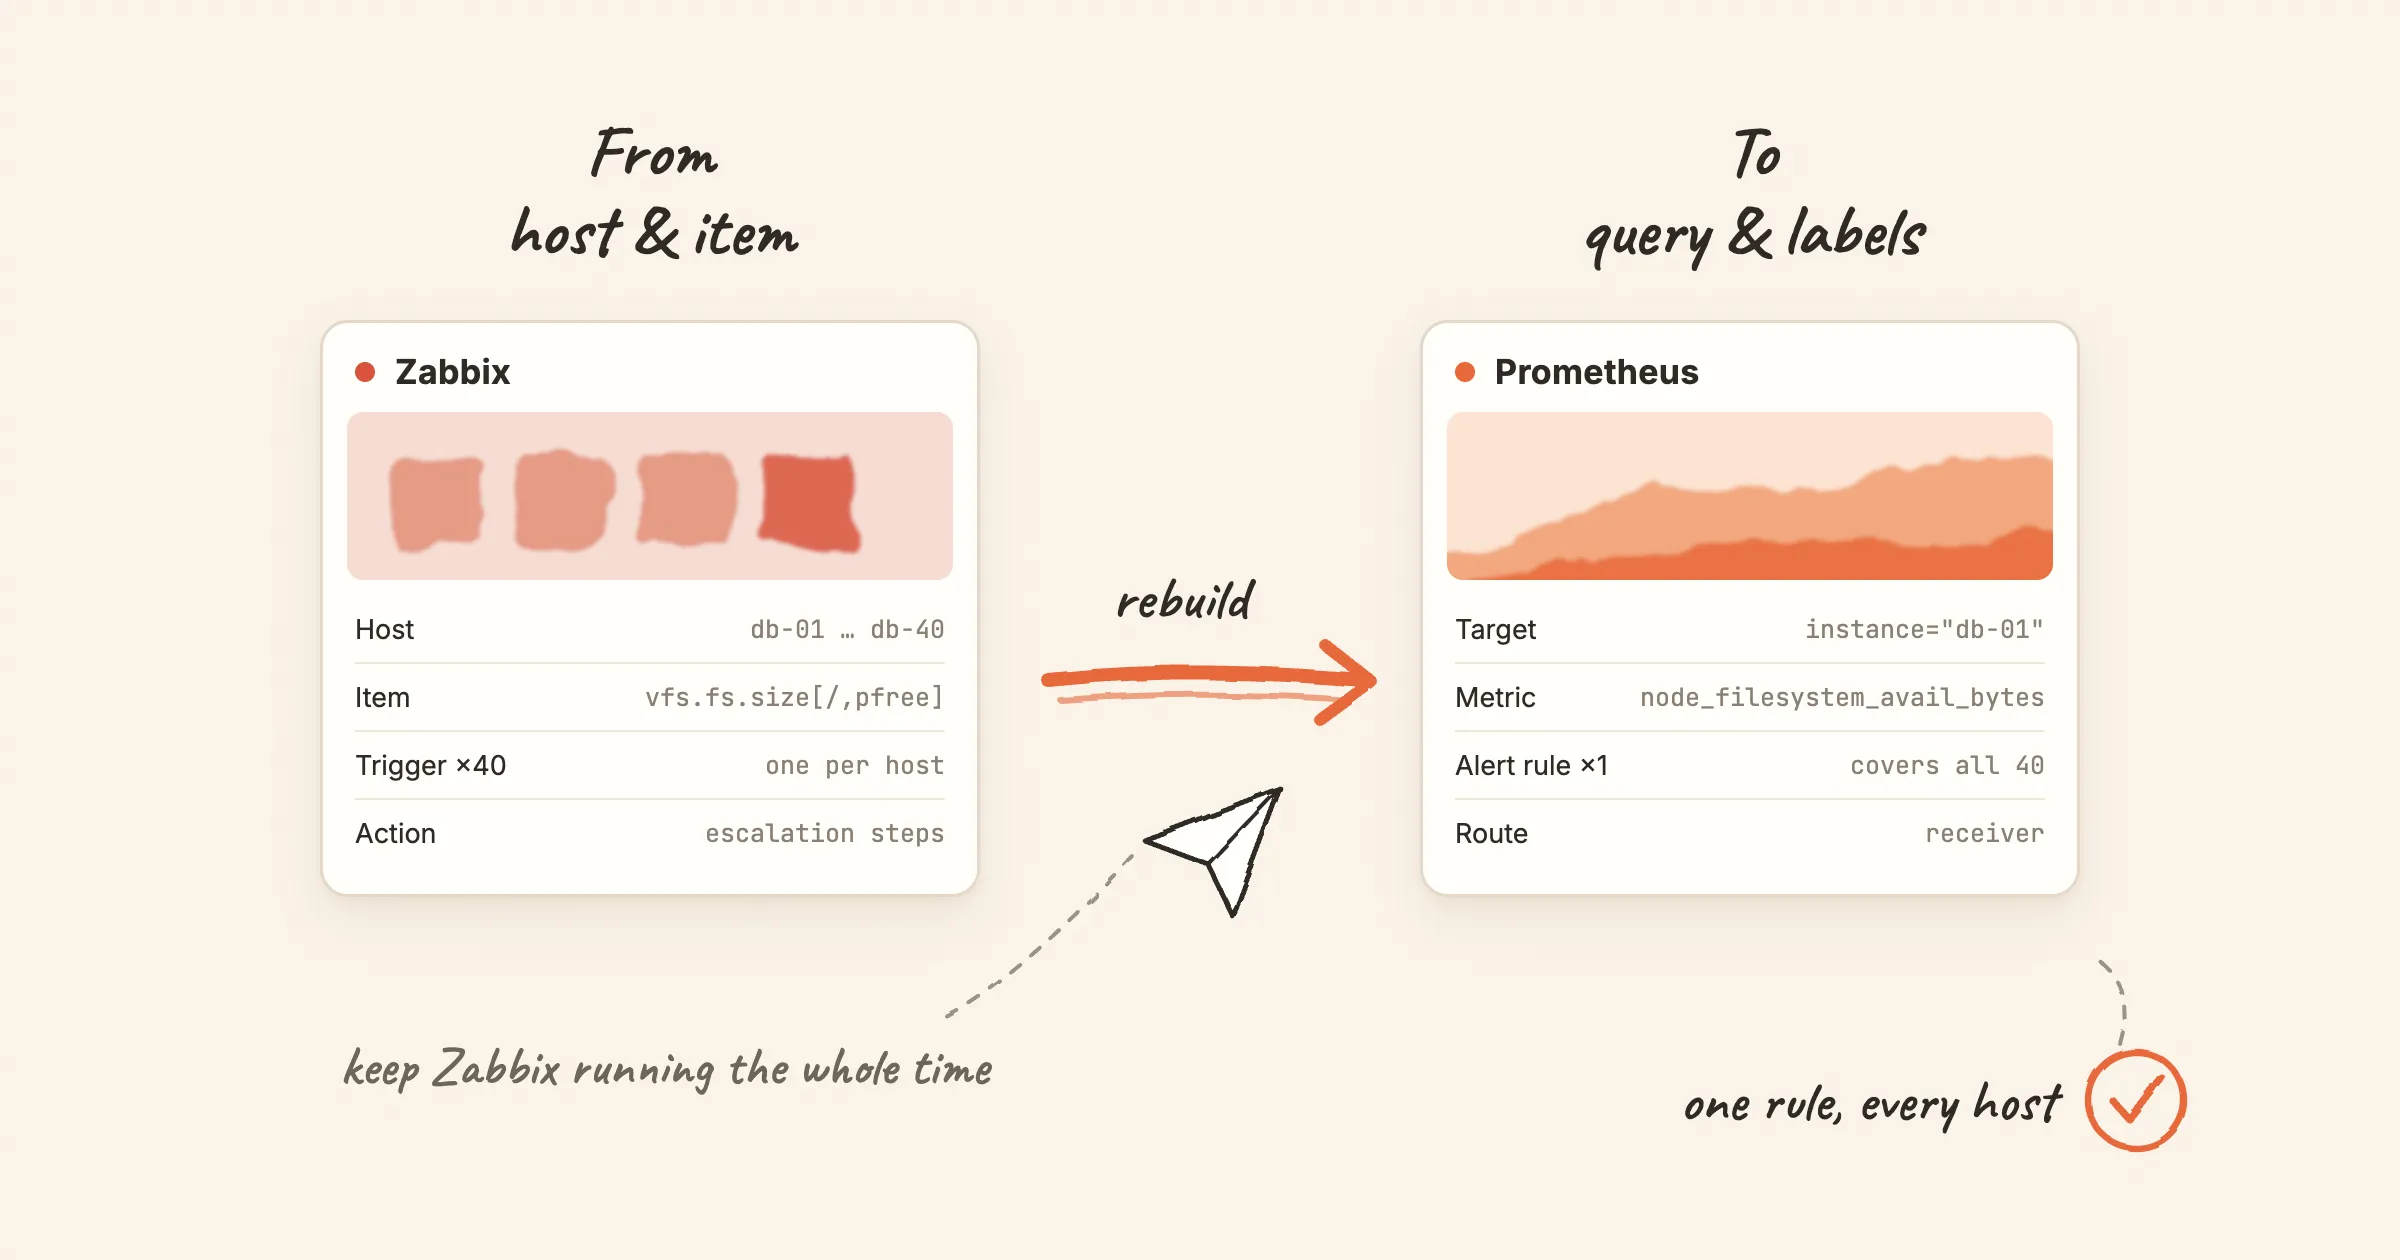
A concept-by-concept map from Zabbix to Prometheus: hosts, items, triggers, LLD, dependencies, maintenance. Plus the gaps with no equivalent and a migration order that never turns Zabbix off.