5 posts tagged with "Prometheus"

Prometheus metrics, rules and operations.

View all tags

How long should a Prometheus alert wait? Data from 692 rules

· 9 min read
Eric Qin

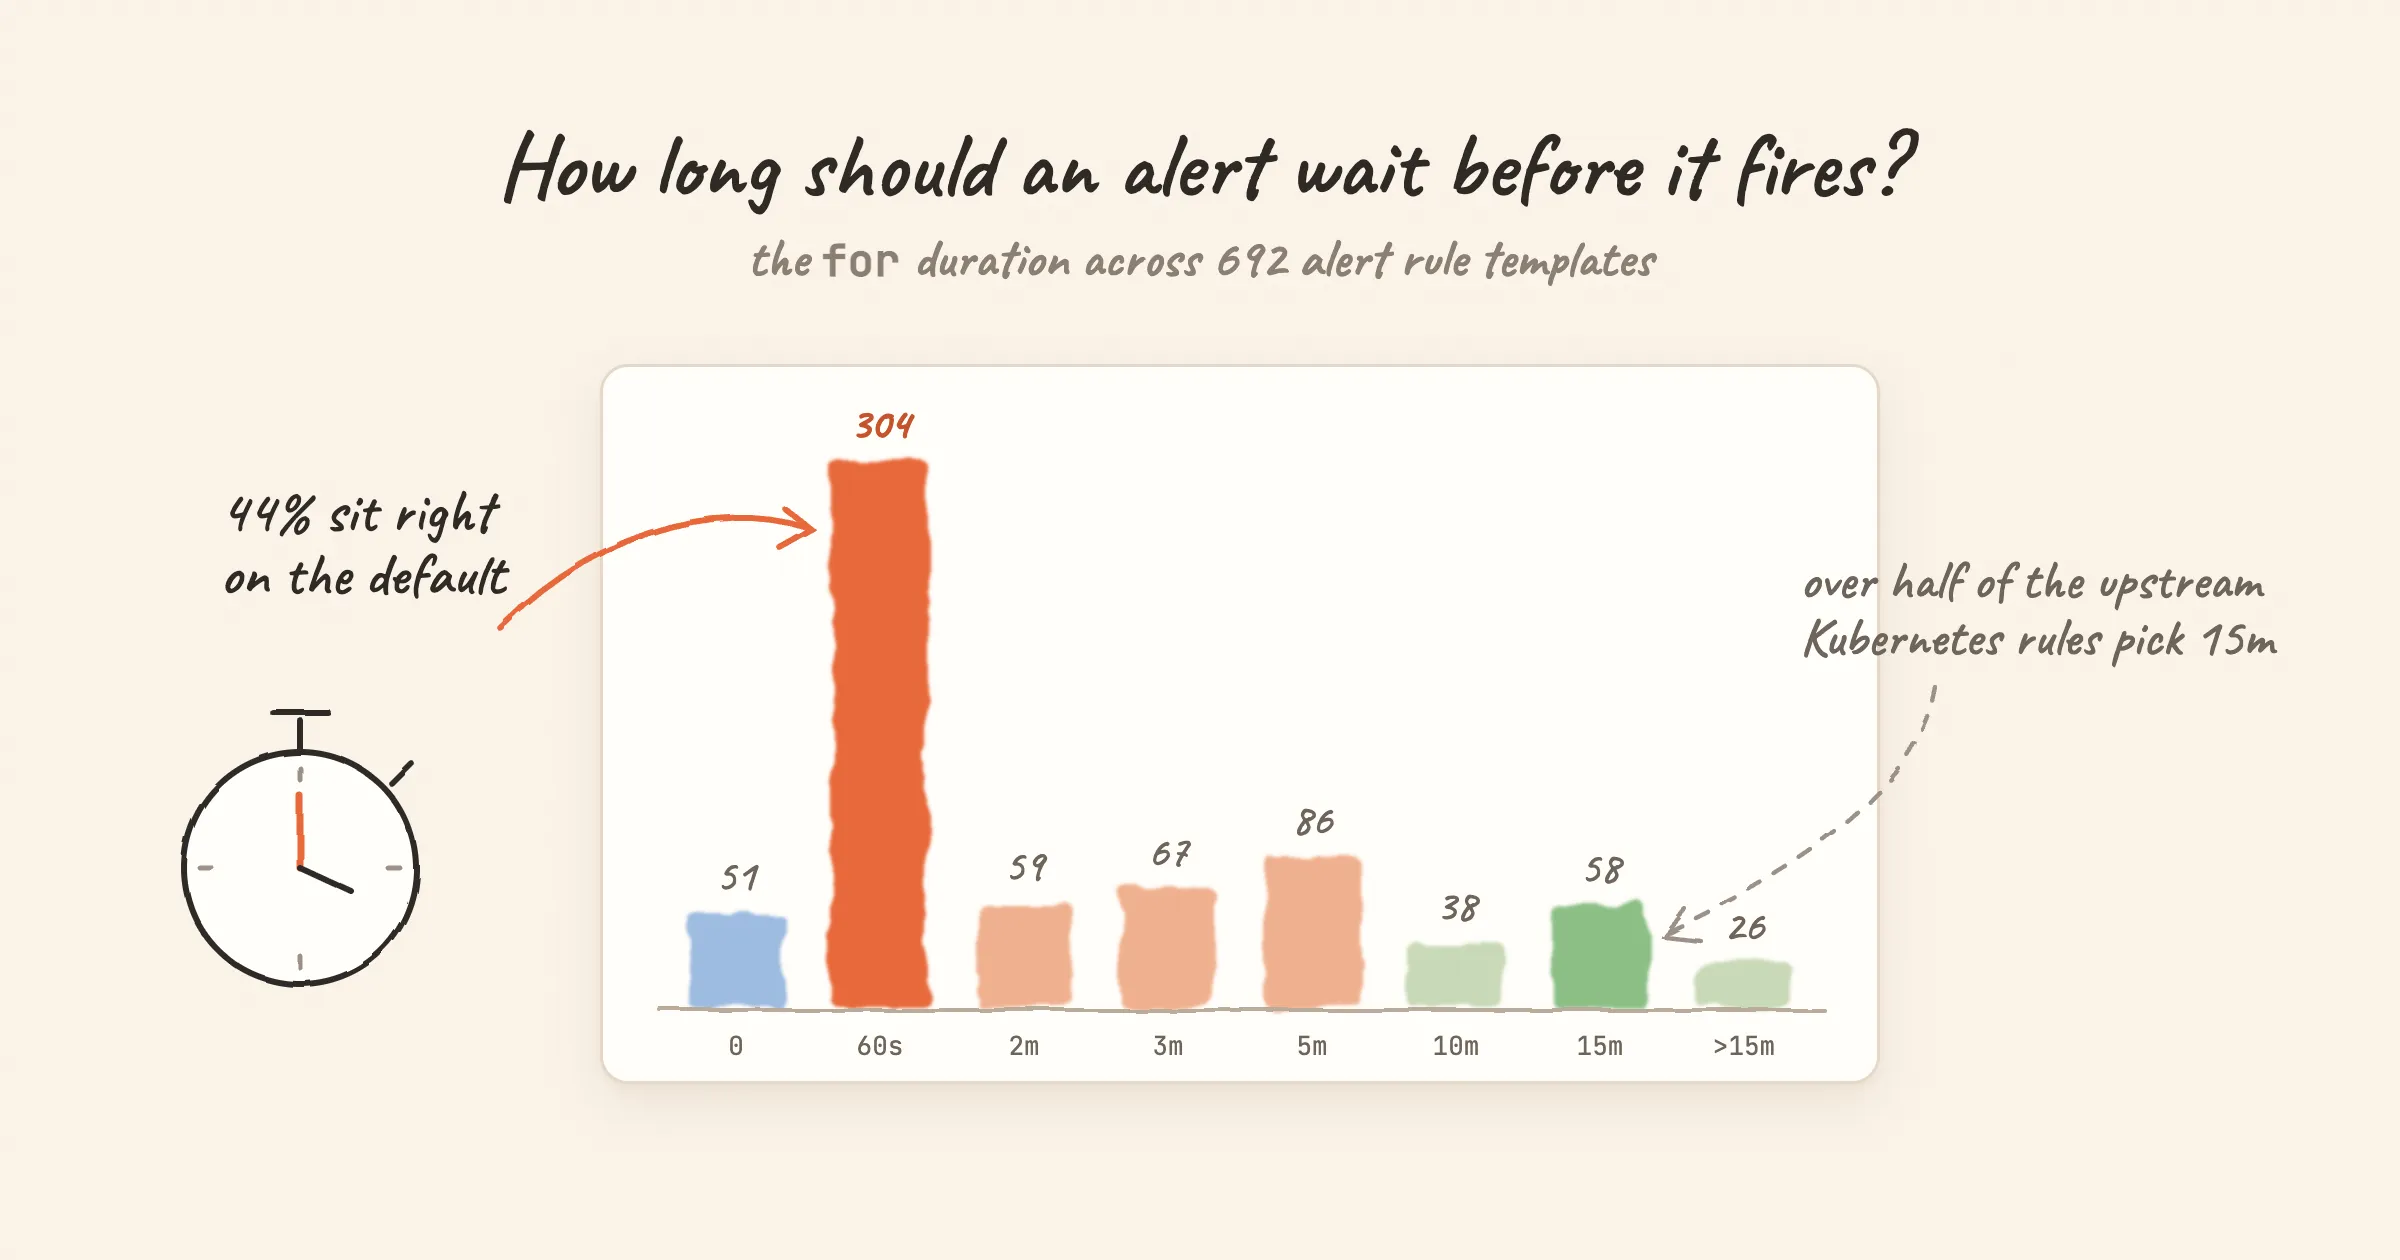
A histogram of for durations across 692 alert rule templates, with 304 rules at 60 seconds

Every alert rule answers two questions: what counts as bad, and how long it has to stay bad. Most review effort goes into the first one, the expression and the threshold. The second is the for duration, and it often gets whatever value the tool filled in.

We wanted to know how often that happens, so we counted. Nightingale ships alert rule templates for 49 integrations. 692 rules, and 304 of them (44%) have a for duration of exactly 60 seconds, which is the default in Nightingale's rule editor. This post walks through what the numbers show and what for value suits which kind of alert.
kube-state-metrics vs metrics-server vs cAdvisor vs node_exporter

· 7 min read
Eric Qin

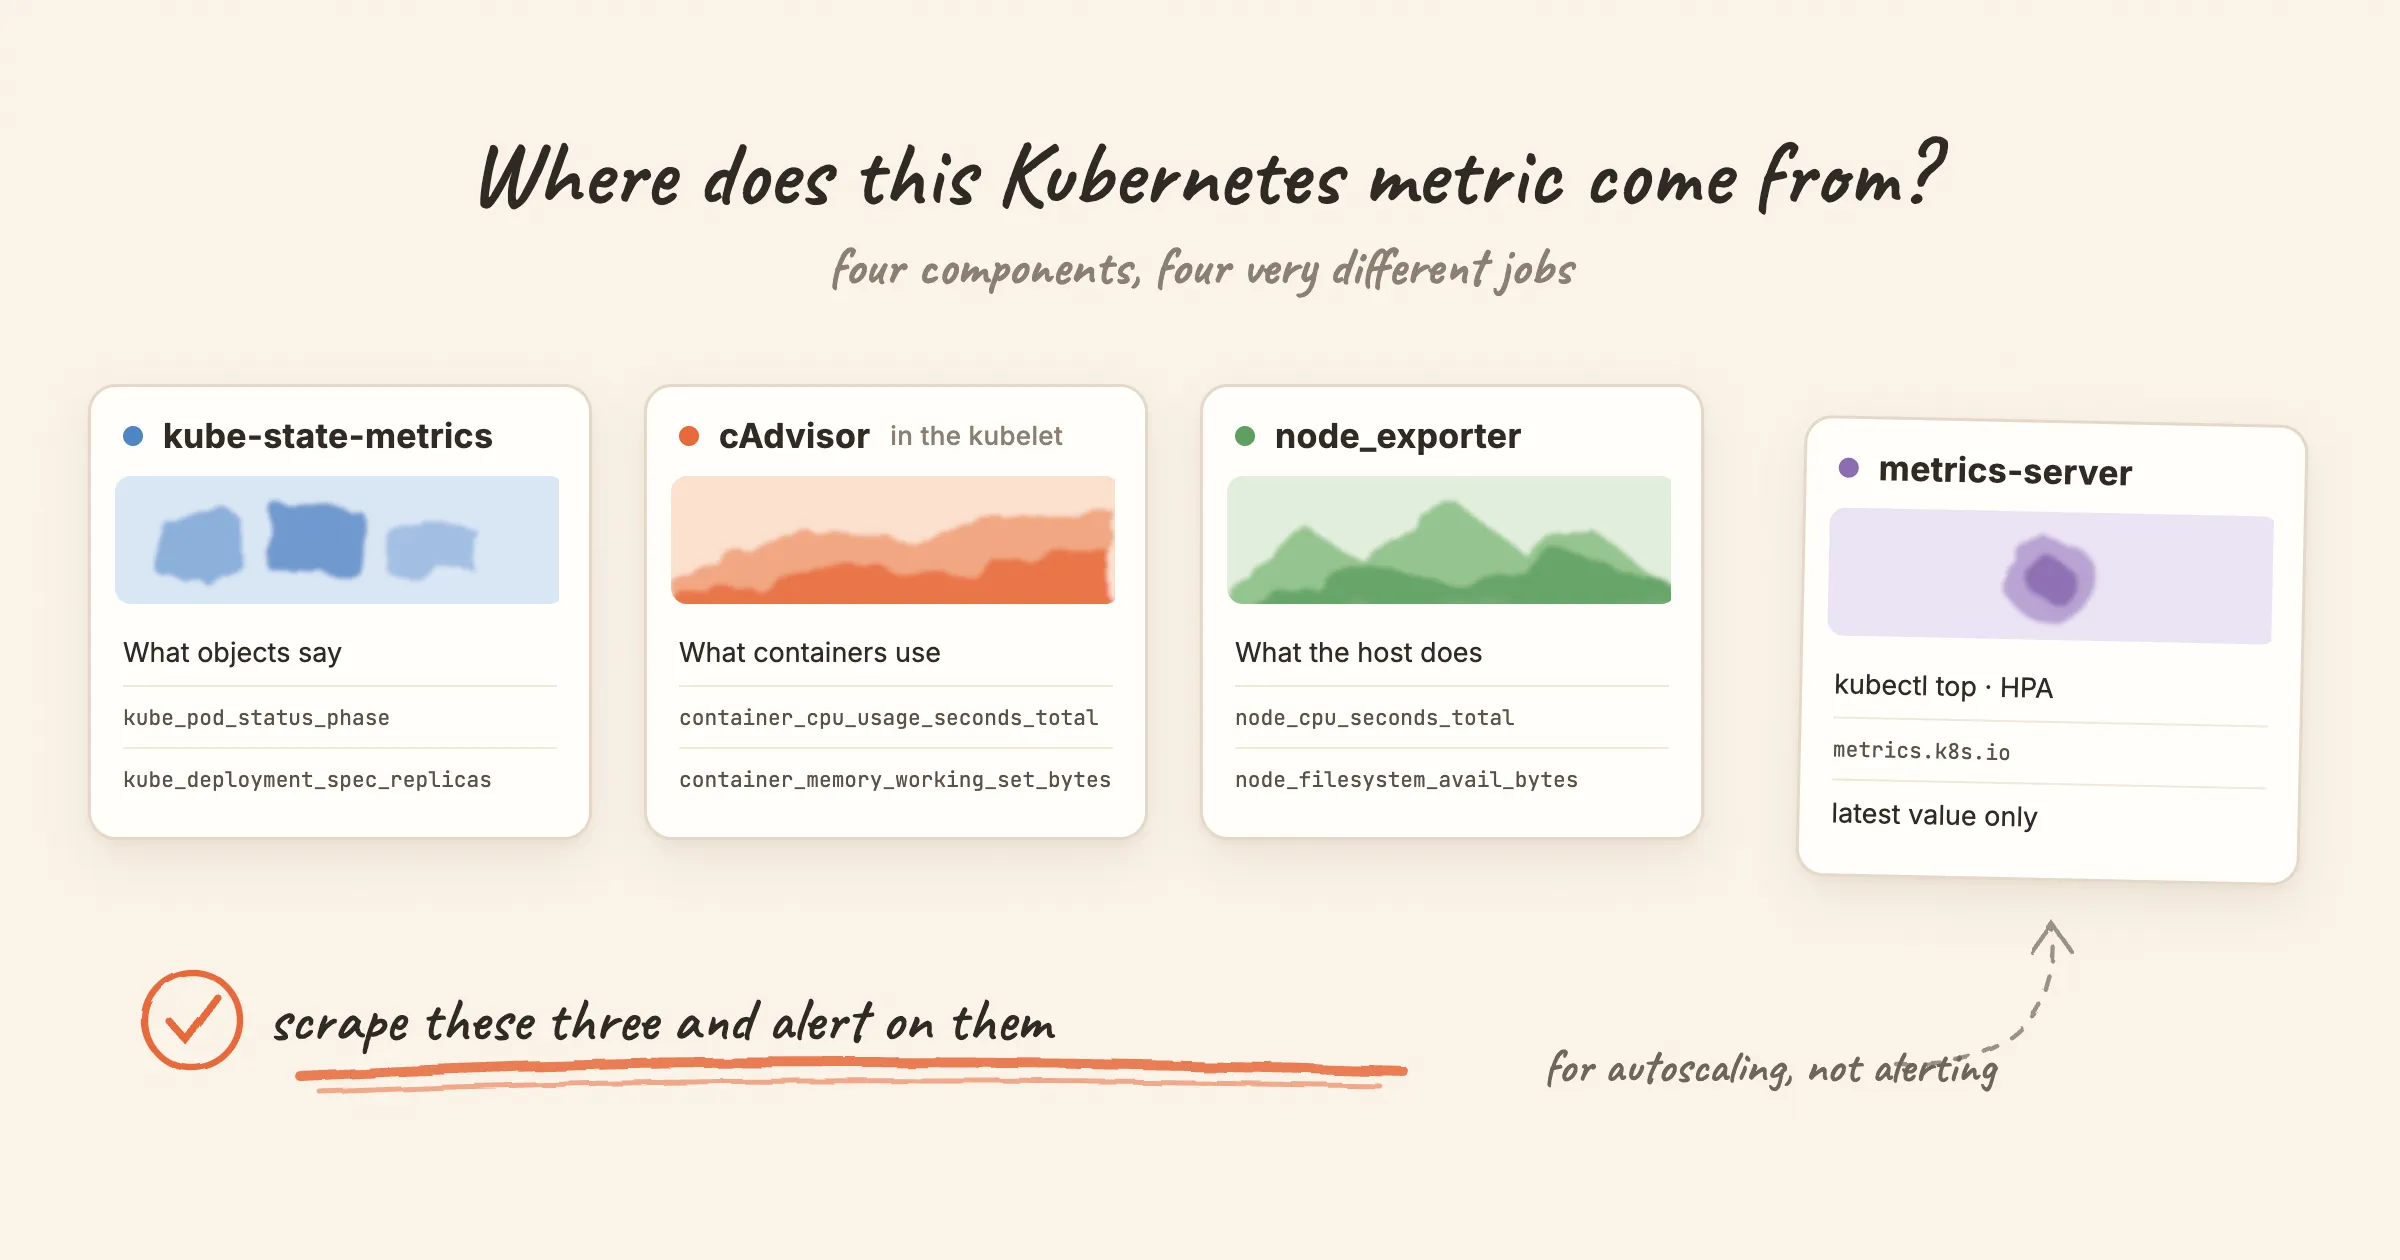
Four Kubernetes metric sources: kube-state-metrics, cAdvisor, node_exporter and metrics-server

Kubernetes metrics come from four places, and their names look alike. kube_pod_container_resource_limits, container_memory_working_set_bytes, node_memory_MemAvailable_bytes and the numbers in kubectl top all sound like they describe the same thing. They are made by different components and they answer different questions. Only three of the four are meant for monitoring.

This post explains what each component measures and how to tell which one a metric came from. It also covers the renames that make a query copied from a 2019 blog post return nothing.

Prometheus high availability: storage vs alerting

· 7 min read
Eric Qin

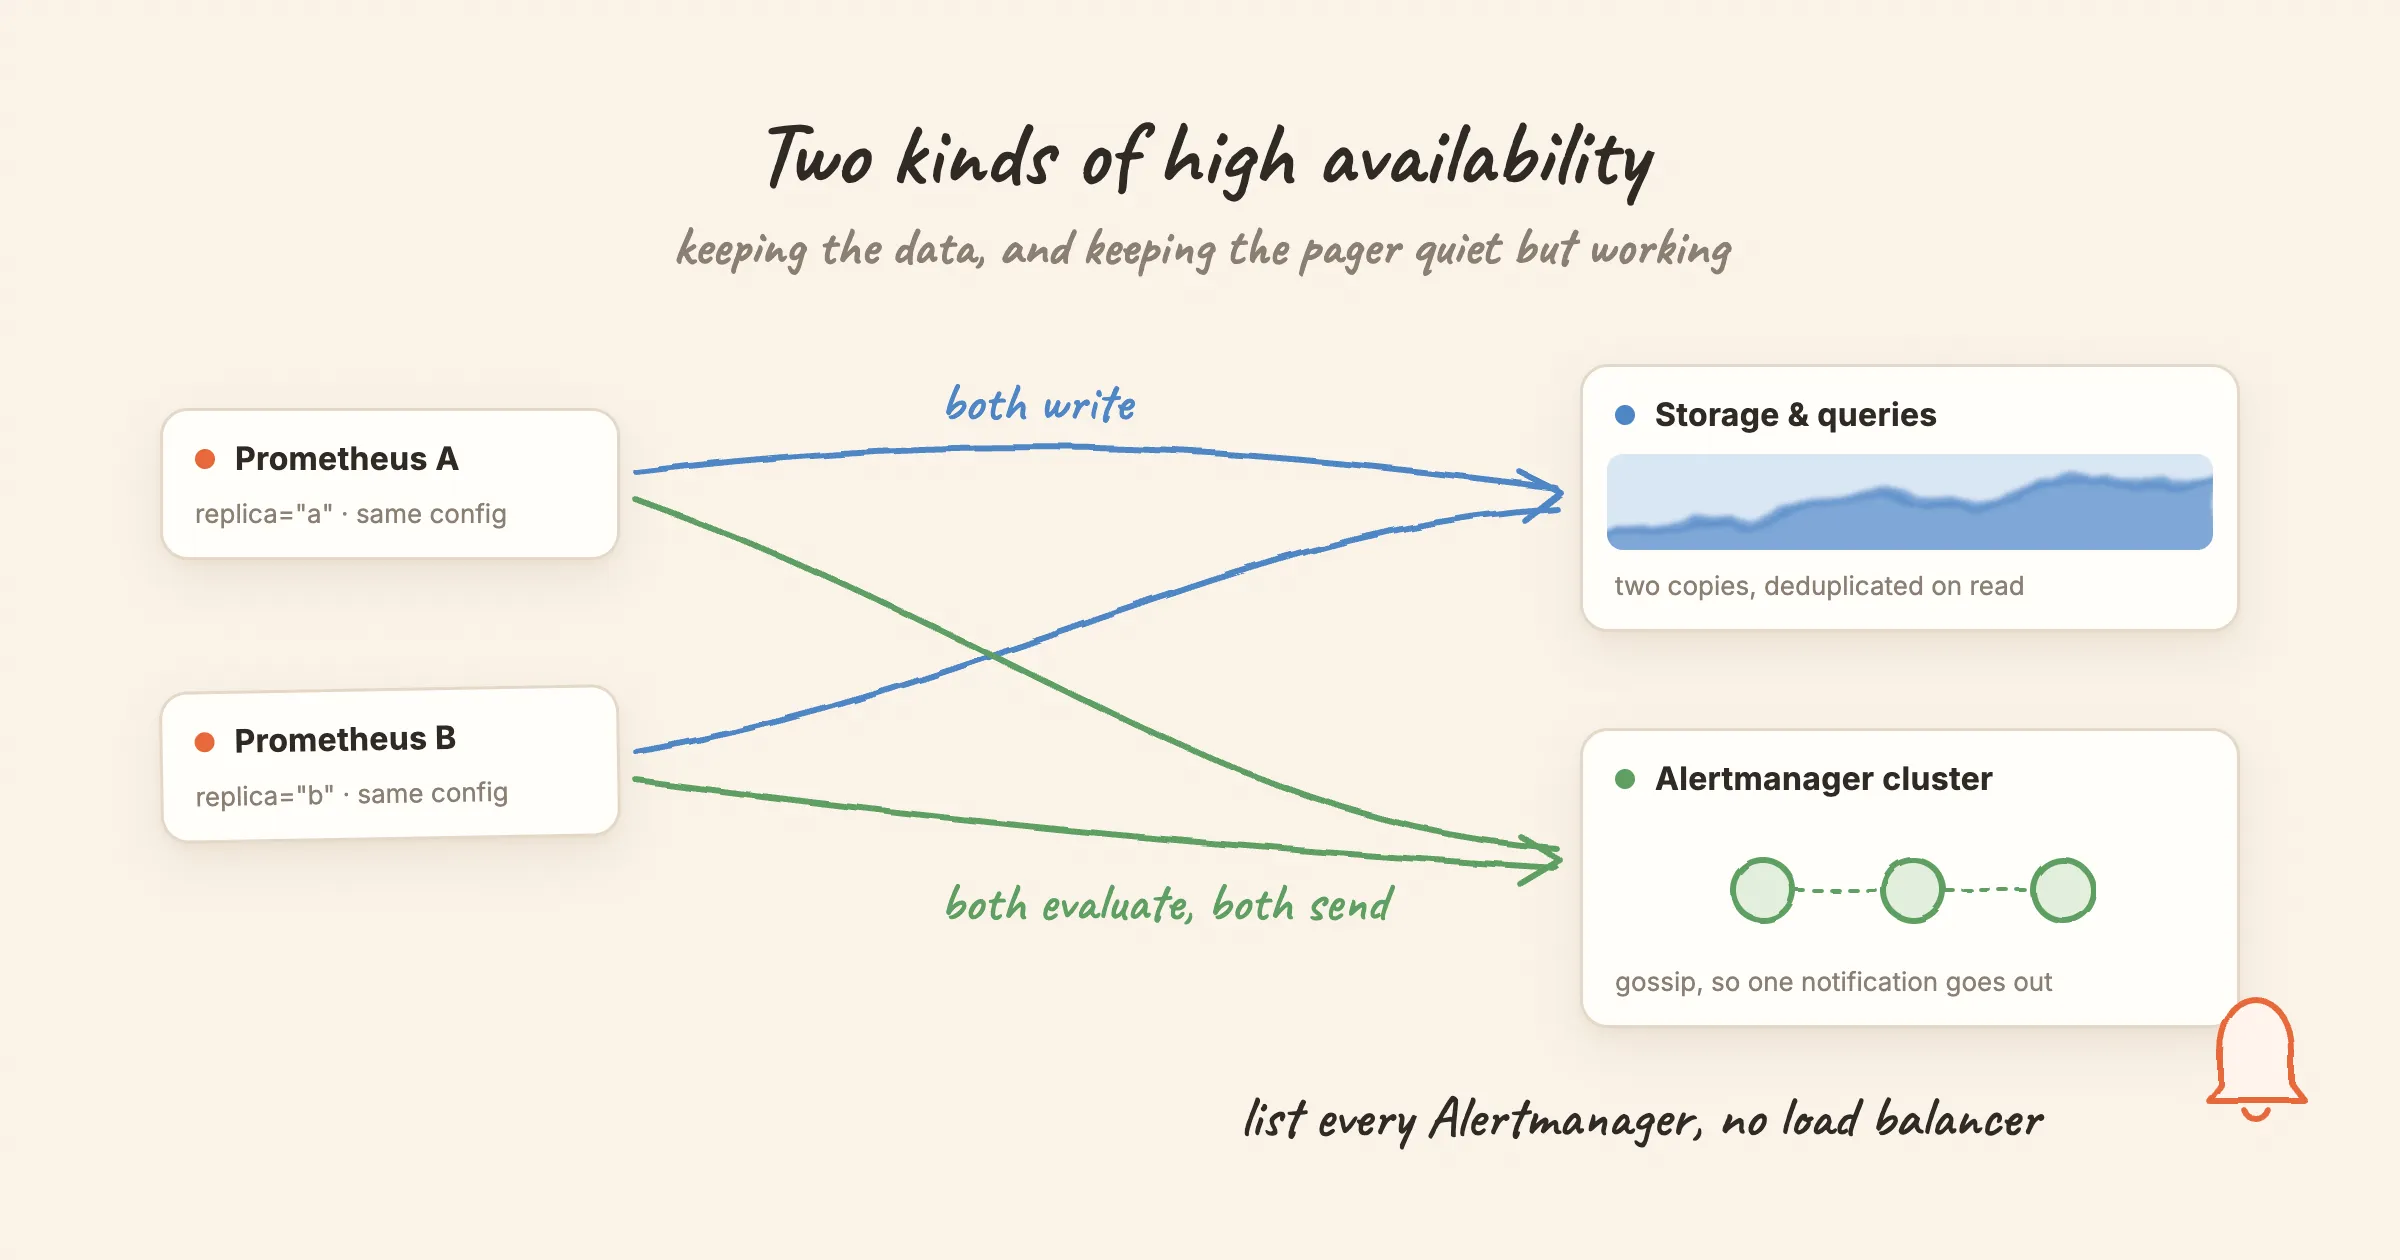
Two Prometheus replicas writing to deduplicated storage and sending alerts to a clustered Alertmanager

Ask how to make Prometheus highly available and the usual answer is "run two of them". That is correct, and it is only half the job. Two replicas give you two copies of every alert and two slightly different copies of every time series. Each needs its own fix, and the fixes don't share a configuration.

This post separates the two problems: keeping alerts flowing exactly once, and keeping the data queryable without gaps. It ends with a checklist.

Symptom-based alerting with Prometheus

· 7 min read
Eric Qin

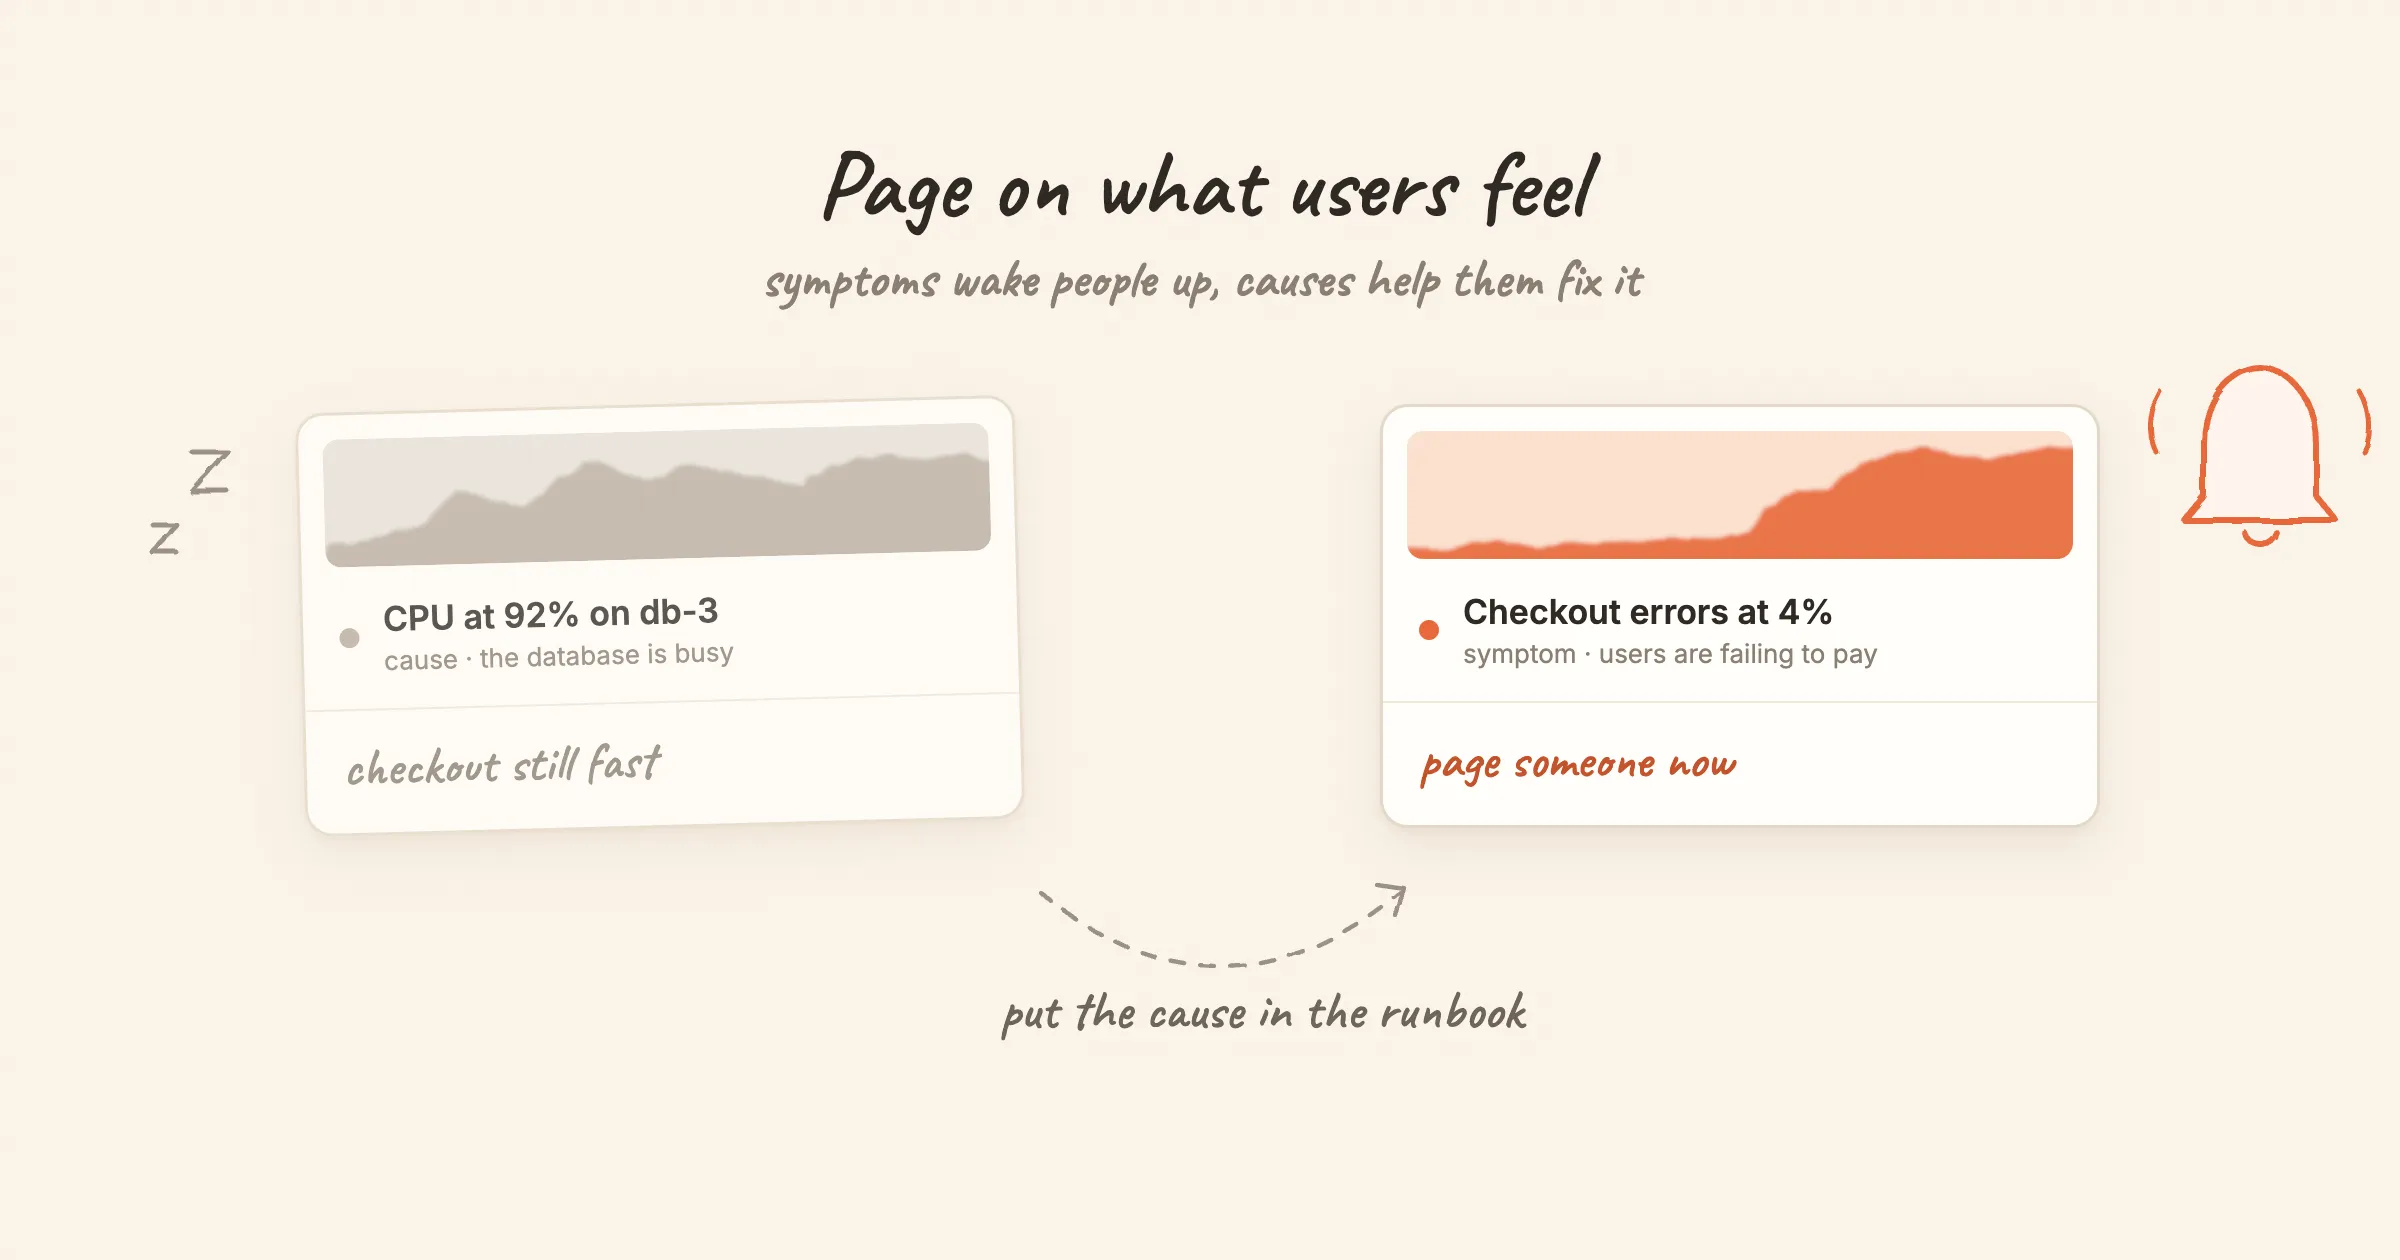
A greyed-out CPU alert next to a highlighted checkout error-rate alert

At 3 a.m. an alert says CPU is at 92% on db-3. The on-call engineer opens the dashboards. Checkout is fast, errors are flat, and nobody is affected. The alert was true and useless.

A week later, checkout fails for 20 minutes because a dependency returns errors. CPU is fine, memory is fine, every host looks healthy. No alert fires.

Both failures have the same root cause: the rules watch causes, not symptoms. This post explains the difference, shows what symptom rules look like in PromQL, and explains where cause alerts still earn their place.

Migrating from Zabbix to Prometheus

· 7 min read
Eric Qin

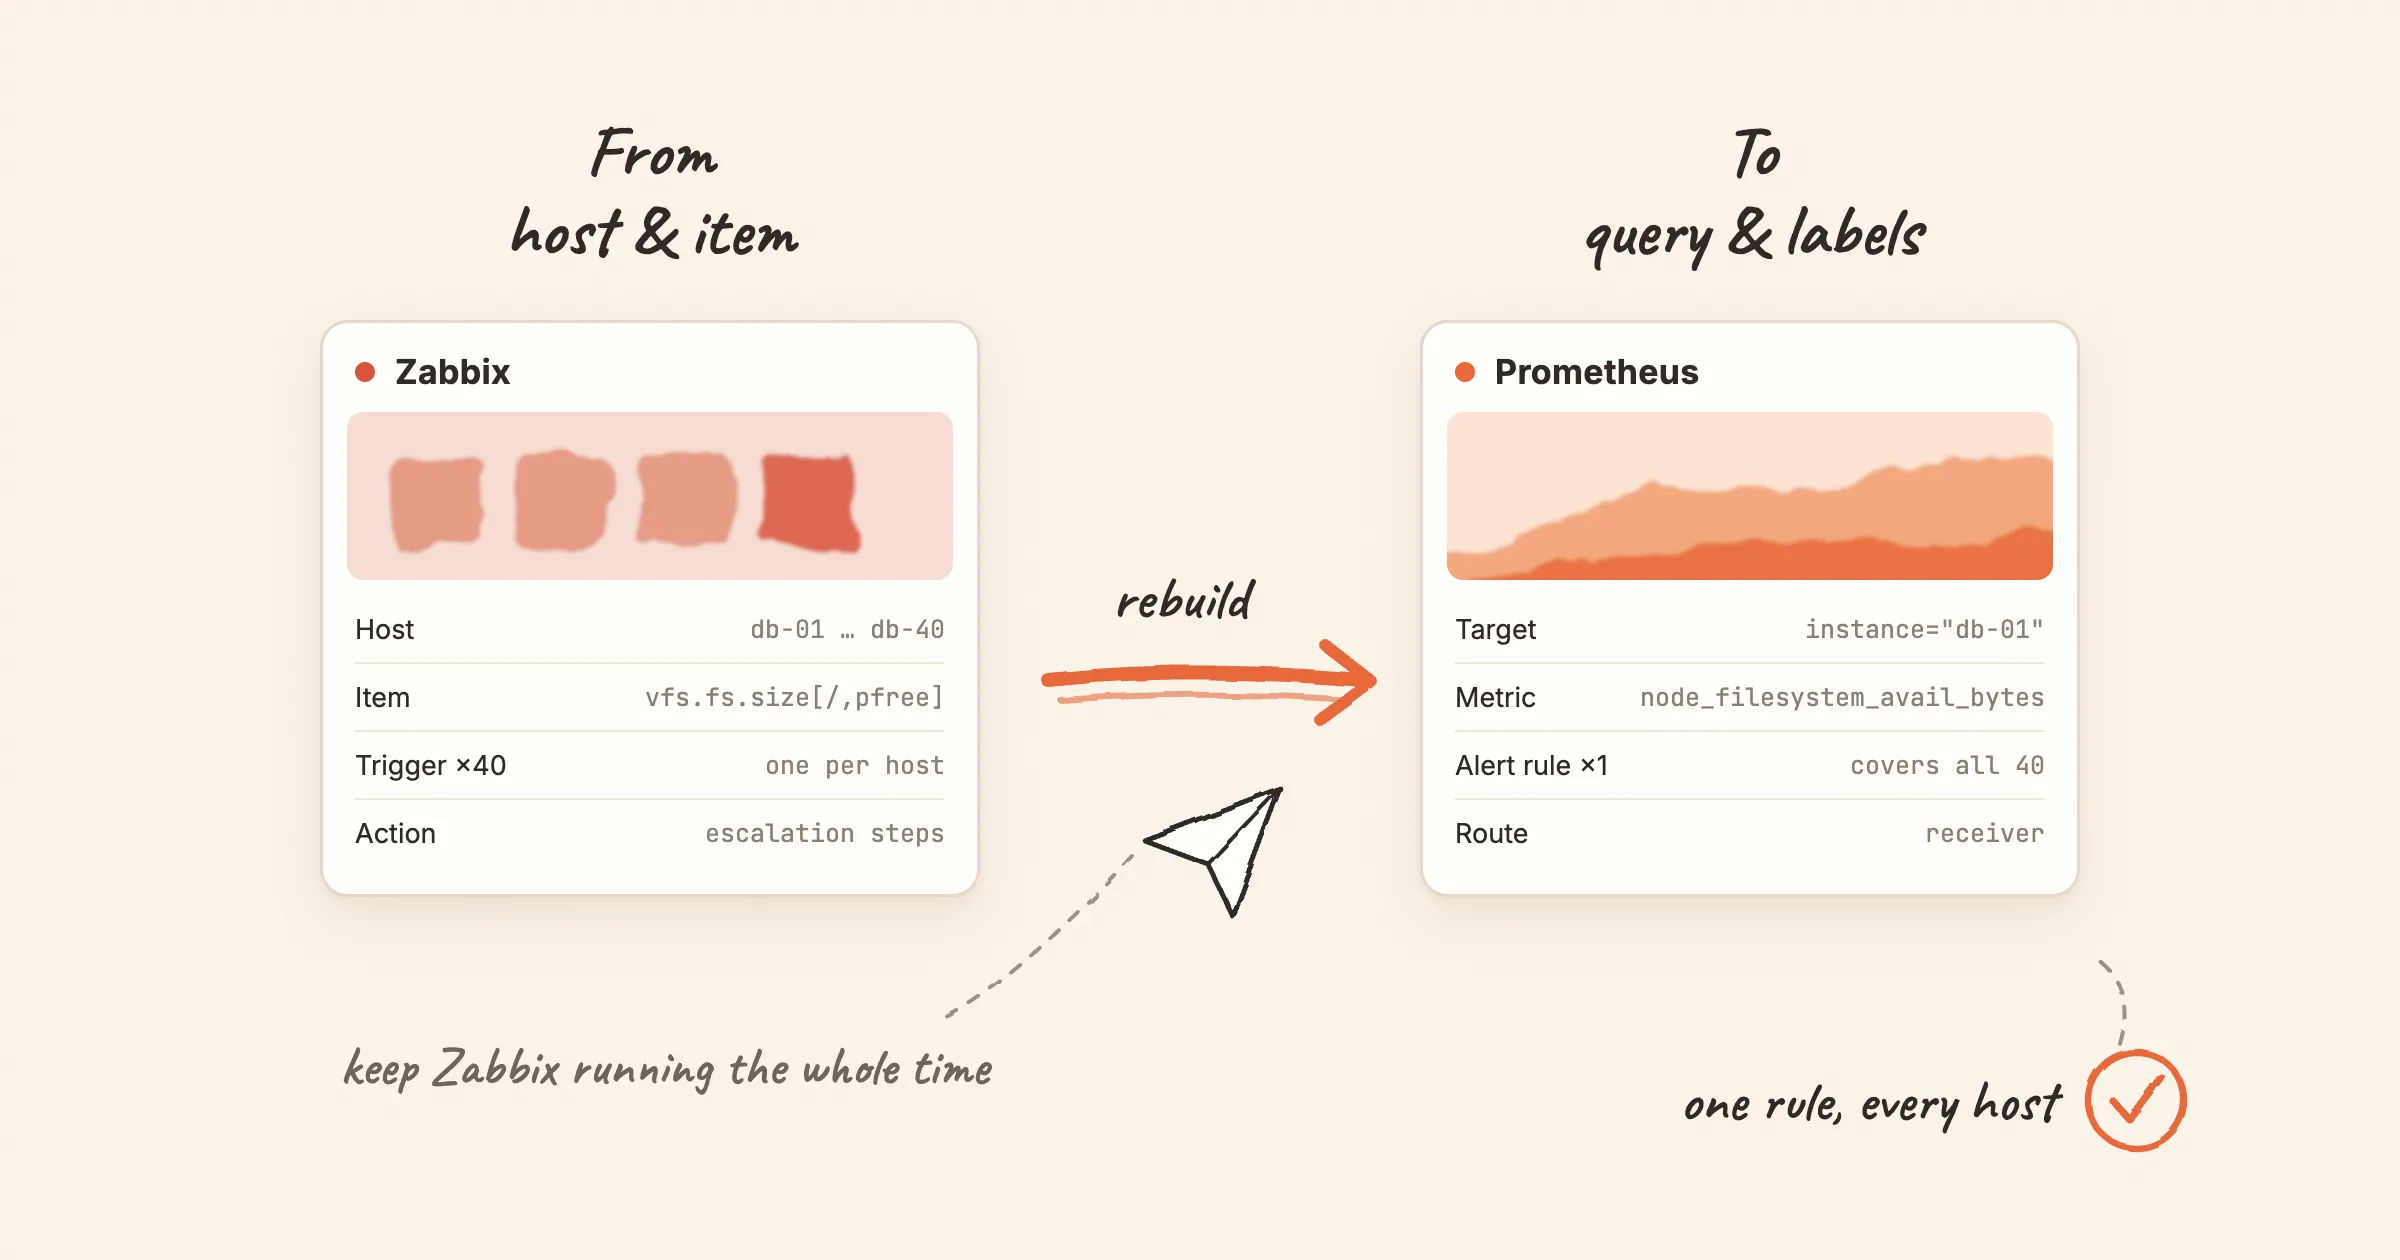
From Zabbix hosts, items and triggers to Prometheus targets, metrics and one alert rule covering every host

Moving from Zabbix to Prometheus is not a data migration. There is no export file that turns into rule files, and no tool that converts triggers into PromQL. The two systems model monitoring differently. Most of the work is translating concepts, then rebuilding a smaller set of rules on top of them.

This post maps each Zabbix concept to its Prometheus counterpart, lists the parts that have no equivalent, and suggests an order of work that keeps Zabbix running until the end.