Prometheus high availability: storage vs alerting
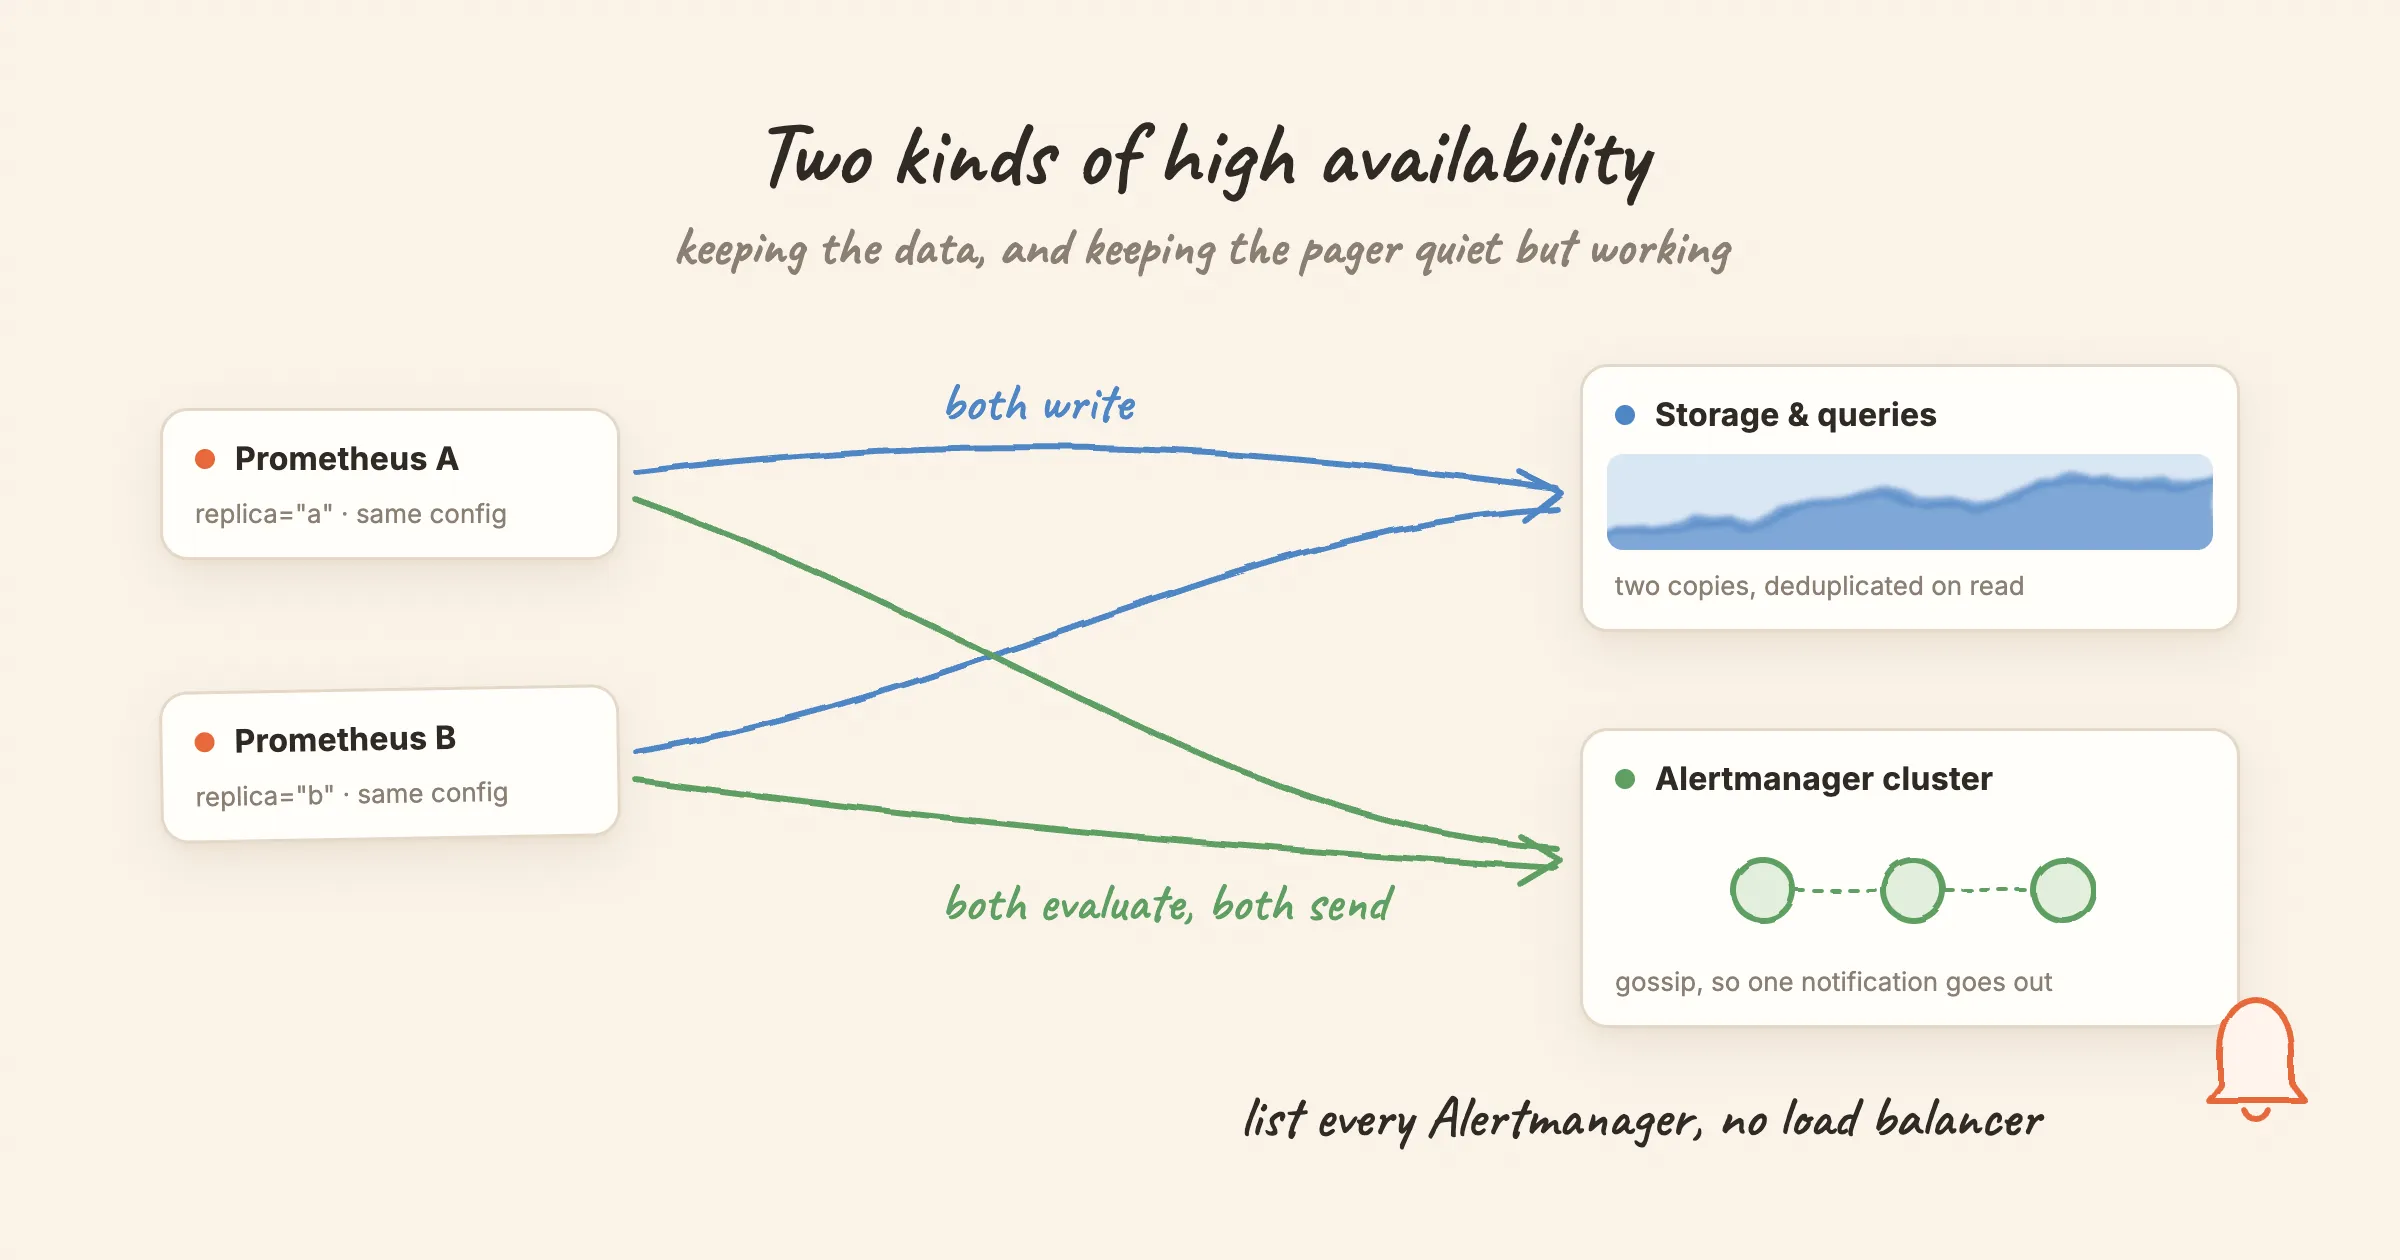
Ask how to make Prometheus highly available and the usual answer is "run two of them". That is correct, and it is only half the job. Two replicas give you two copies of every alert and two slightly different copies of every time series. Each needs its own fix, and the fixes don't share a configuration.
This post separates the two problems: keeping alerts flowing exactly once, and keeping the data queryable without gaps. It ends with a checklist.
How Prometheus does HA
Prometheus has no clustering. High availability means running two (or more) identical servers. Each one scrapes the same targets, evaluates the same rules and keeps its own local copy of the data. They don't talk to each other.
The copies are never identical. Each replica scrapes at its own moment, so the timestamps differ. When one replica restarts, it has a gap that the other doesn't. That is fine for alerting, and a problem for dashboards.
The usual convention is to give each replica an external label that says which one it is:
# prometheus-a.yml (prometheus-b.yml says replica: b)
global:
  external_labels:
    cluster: prod-eu
    replica: a
Problem 1: alerts should arrive once, even when a replica dies
Both replicas evaluate every rule, so both send every alert. Deduplication happens in Alertmanager.
Cluster the Alertmanagers. Alertmanager instances gossip with each other. You start each one with --cluster.peer pointing at the others, and they share notification state and silences. When two replicas send the same alert, the cluster sends one notification.
Point every Prometheus at every Alertmanager. The Alertmanager README is explicit: do not load-balance traffic between Prometheus and its Alertmanagers. Give each Prometheus the full list, because every alert has to reach every instance:
alerting:
  alertmanagers:
    - static_configs:
        - targets: ['am-0:9093', 'am-1:9093', 'am-2:9093']
Drop the replica label from alerts. Alerts carry the external labels. If replica A sends {alertname="X", replica="a"} and replica B sends {alertname="X", replica="b"}, Alertmanager sees two different alerts and notifies twice. Strip the label on the way out:
alerting:
  alert_relabel_configs:
    - action: labeldrop
      regex: replica
The Prometheus Operator does this for you with its own replica label. Hand-built setups often miss it, and the symptom is that every page arrives twice.
With these three in place, alerting HA works well. If replica A dies, replica B was evaluating the same rules all along, so there is no gap in detection. If an Alertmanager dies, Prometheus is still sending to the others.
Problem 2: dashboards and queries should not show gaps
This is the half that "run two" does not solve. Point Grafana at replica A, and you see replica A's gaps. Put a load balancer in front of both, and consecutive refreshes can hit different replicas and draw slightly different lines.
The fix is a layer that knows the two replicas hold the same data and merges them. The three common options handle the replica label in different ways, and that difference matters:
| Store | How it deduplicates | What the replicas' labels must look like |
|---|---|---|
| Thanos | Thanos Querier merges series that differ only in the label named by --query.replica-label | Different: each replica has its own replica value |
| Grafana Mimir | The HA tracker elects a leader replica per cluster, keeps its samples and drops the rest. It switches leader if the current one sends nothing for 30 seconds by default | Different: cluster plus a __replica__ label by default |
| VictoriaMetrics | -dedup.minScrapeInterval keeps one sample per series per interval. Set it equal to your scrape_interval | Identical: the docs require the HA pair to write the same series, so no per-replica label |
So a setup moved from Thanos to VictoriaMetrics needs its replica label removed, and a setup moved the other way needs one added. Mixing the conventions gives you either doubled series or a store that silently keeps one replica.
Long-term retention is a separate decision from HA. Thanos, Mimir and VictoriaMetrics also keep data longer than a local Prometheus. But you can have deduplicated HA with short retention, or long retention with a single replica. Decide each one on its own.
Scaling is not HA
Federation, functional sharding (one Prometheus per team or per cluster) and hashmod sharding spread load. They don't add redundancy: each shard is still a single point of failure until you run it as a pair. If you shard, every shard needs the replica treatment above.
Where a separate alerting engine changes the picture
Everything above assumes Prometheus evaluates the rules. Some setups move evaluation out of Prometheus: Grafana Alerting, vmalert, Thanos Ruler, or Nightingale. Then storage HA and alerting HA become two different systems.
Nightingale takes a different approach from a Prometheus pair, with a different trade-off:
- It queries one deduplicated data source. Prometheus behind Thanos Querier, VictoriaMetrics or Mimir. The storage-side HA from Problem 2 is still needed, and Nightingale doesn't replace it.
- Rules are shared out, not duplicated. Several
n9einstances share one MySQL and one Redis. Each live instance sends a heartbeat every second. The live instances form a consistent hash ring per data source, and each rule runs on exactly one instance. One evaluation means one event, so no Alertmanager-style deduplication is needed. - The trade-off is a failover gap. An instance counts as dead after 30 seconds without a heartbeat, and only then does its share of rules move to another instance. A freshly started instance also waits 30 seconds before evaluating. A Prometheus pair has no such gap, because the other replica was evaluating all along.
- Shared dependencies need their own HA. If MySQL is down, everything is down. If Redis is unreachable at startup, the process exits. Running several
n9einstances protects against losing ann9eprocess, and nothing else.
Neither design is better in general. Duplicate evaluation with downstream deduplication gives zero-gap failover and costs you a deduplication layer that must be configured exactly right. Single evaluation with a hash ring avoids duplicates by construction and costs you up to 30 seconds of blindness for the rules on a failed instance. The details are in High availability and failure domains.
Checklist
Alerting
- Two or more Prometheus replicas with identical rule files.
- Alertmanager clustered with
--cluster.peer; the cluster port reachable between instances. - Every Prometheus lists every Alertmanager. No load balancer in between.
- The replica label dropped in
alert_relabel_configs. - Tested: stop one replica and one Alertmanager, fire a test alert, and get exactly one notification.
Storage and queries
- A deduplicating layer: Thanos Querier, Mimir's HA tracker or VictoriaMetrics deduplication.
- Replica labels set the way that layer expects. Thanos and Mimir need them to differ; VictoriaMetrics needs them identical.
- Dashboards and alert rules query the deduplicated endpoint, not a single replica.
- Tested: restart one replica and check that a dashboard over that window shows no gap.
Everything
- The monitoring system is monitored from outside itself. A dead-man's-switch alert that always fires, and pages when it stops arriving, catches the case where the whole alerting path is down.
The last item is the one most often skipped. Every check above runs inside the system it is checking.